Free Access
Fig. 2
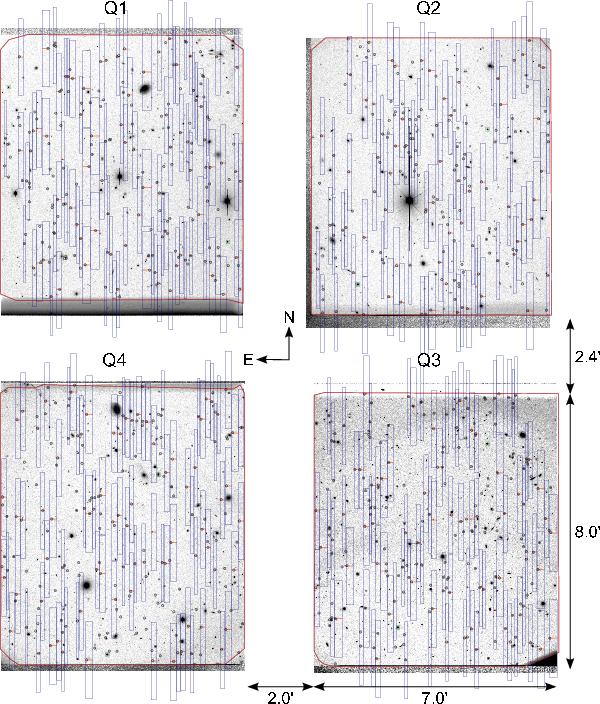
Illustration of the slit assignment in pointing W1P082. The slits are shown in red and associated rectangles represent the typical dispersion of the spectra. All objects meeting the survey selection criteria (potential spectroscopic targets) are represented by black circles.
Current usage metrics show cumulative count of Article Views (full-text article views including HTML views, PDF and ePub downloads, according to the available data) and Abstracts Views on Vision4Press platform.
Data correspond to usage on the plateform after 2015. The current usage metrics is available 48-96 hours after online publication and is updated daily on week days.
Initial download of the metrics may take a while.