Fig. 18
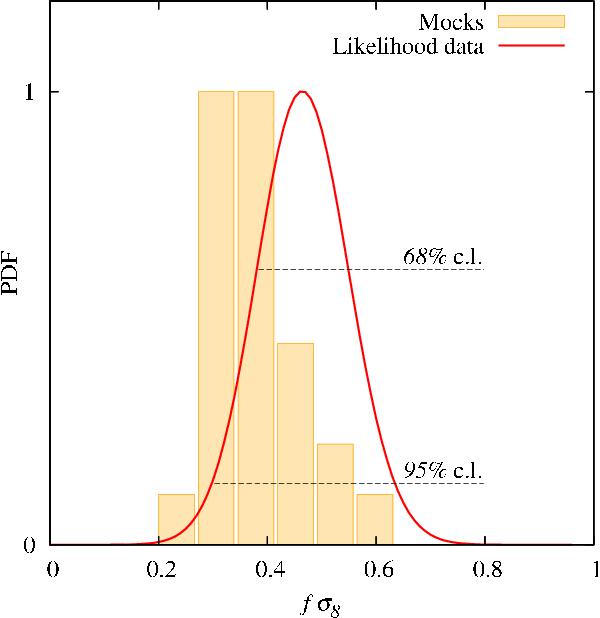
Marginalised likelihood distribution of fσ8 in the data (solid curve) and distribution of fitted values of fσ8 for the 26 individual MultiDark simulation mocks (histogram). These curves show a preferred value and a dispersion in the data that is consistent at the 1σ level with the distribution over the mocks.
Current usage metrics show cumulative count of Article Views (full-text article views including HTML views, PDF and ePub downloads, according to the available data) and Abstracts Views on Vision4Press platform.
Data correspond to usage on the plateform after 2015. The current usage metrics is available 48-96 hours after online publication and is updated daily on week days.
Initial download of the metrics may take a while.