Fig. 17
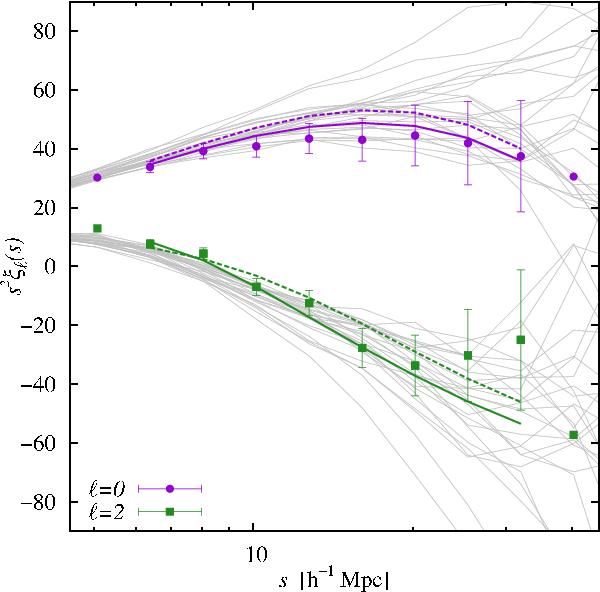
Monopole and quadrupole moments of the redshift-space correlations, as a function of scale. The shallow curves show the results for the 26 individual MultiDark simulation mocks; the points are for the measured VIPERS data at 0.7 < z < 1.2, with assigned error bars based on the scatter in the mocks. The solid and dotted lines correspond to the best fitting models to the data for model B with Gaussian or Lorentzian damping function respectively.
Current usage metrics show cumulative count of Article Views (full-text article views including HTML views, PDF and ePub downloads, according to the available data) and Abstracts Views on Vision4Press platform.
Data correspond to usage on the plateform after 2015. The current usage metrics is available 48-96 hours after online publication and is updated daily on week days.
Initial download of the metrics may take a while.