Free Access
Fig. 15
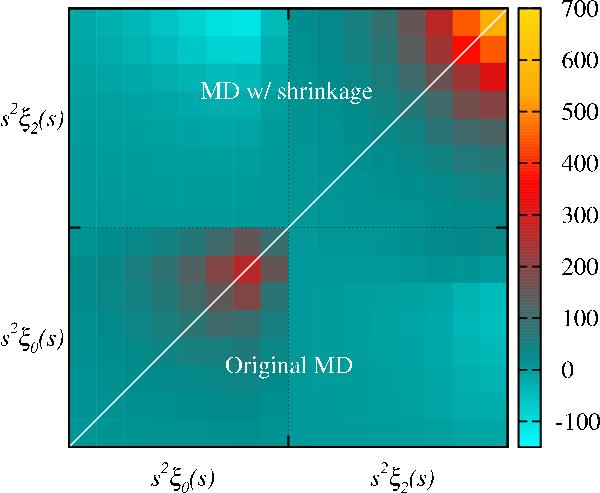
Covariance matrix for the redshift-space distortions analysis. While the lower triangle represents the covariance matrix obtained directly from the MD mocks, the upper triangle corresponds to that obtained after performing shrinkage estimation.
Current usage metrics show cumulative count of Article Views (full-text article views including HTML views, PDF and ePub downloads, according to the available data) and Abstracts Views on Vision4Press platform.
Data correspond to usage on the plateform after 2015. The current usage metrics is available 48-96 hours after online publication and is updated daily on week days.
Initial download of the metrics may take a while.