Fig. 10
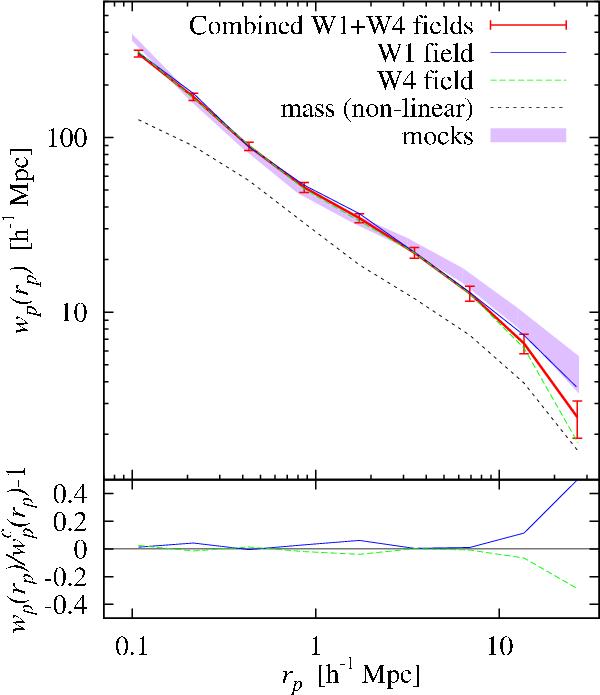
Top panel: projected correlation functions of VIPERS galaxies in the
redshift interval
0.5 < z < 1 for the
individual W1 and W4 fields as well as for the combined sample. As a comparison, the
± 1σ dispersion among the mean
wp(rp) in the mocks is
shown with the shaded region and the non-linear mass prediction in the assumed
cosmology with the dotted curve. Bottom panel: relative difference
between the measured wp(rp)
in the W1 and W4 fields and the combined projected correlation function
 .
.
Current usage metrics show cumulative count of Article Views (full-text article views including HTML views, PDF and ePub downloads, according to the available data) and Abstracts Views on Vision4Press platform.
Data correspond to usage on the plateform after 2015. The current usage metrics is available 48-96 hours after online publication and is updated daily on week days.
Initial download of the metrics may take a while.