Fig. 1
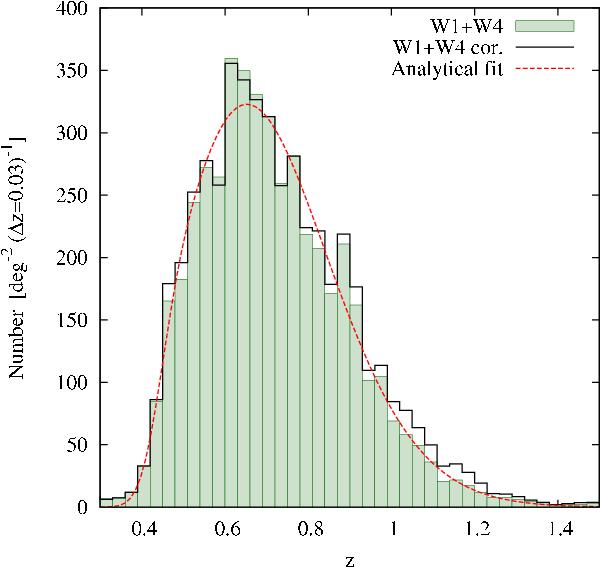
Redshift distribution of the combined W1+W4 galaxy sample when including only reliable redshifts (filled histogram) and that corrected for the full survey completeness (empty histogram) scaled down by 40% (see text). The curve shows the best-fitting template redshift distribution given by Eq. (2) applied to the uncorrected observed distribution.
Current usage metrics show cumulative count of Article Views (full-text article views including HTML views, PDF and ePub downloads, according to the available data) and Abstracts Views on Vision4Press platform.
Data correspond to usage on the plateform after 2015. The current usage metrics is available 48-96 hours after online publication and is updated daily on week days.
Initial download of the metrics may take a while.