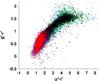
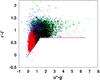
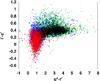
Fig. 3
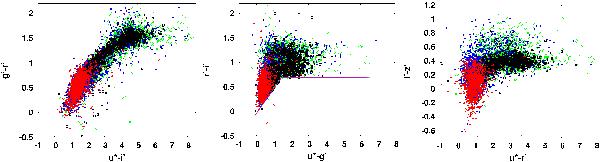
Representative colour–colour plots for the galaxy training sample. Open black squares represent objects with i′-apparent magnitude between 19 and 20 mag; green X-s – galaxies with i′ magnitude between 20 and 21 mag; objects with i′ apparent magnitude between  , and
, and  mag are marked as blue +-s and open red triangles, respectively; in the middle panel of colour–colour plots, the boundaries of VIPERS selection are marked as magenta lines.
Current usage metrics show cumulative count of Article Views (full-text article views including HTML views, PDF and ePub downloads, according to the available data) and Abstracts Views on Vision4Press platform.
Data correspond to usage on the plateform after 2015. The current usage metrics is available 48-96 hours after online publication and is updated daily on week days.
Initial download of the metrics may take a while.