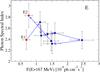
Fig. 6
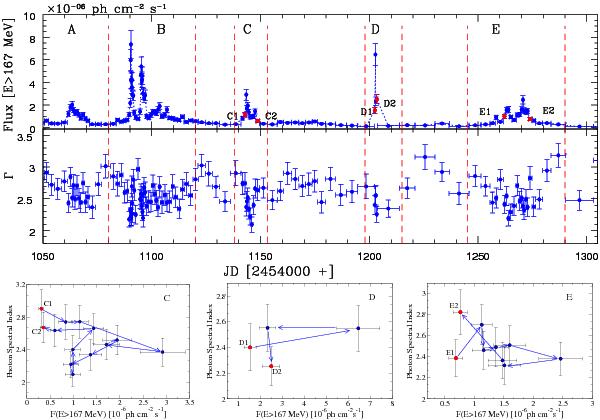
Top panel: the constant uncertainty (15%) light curve of 3C 273 above E0 obtained with the adaptive binning method over the high-activity period (see text for details). The lower panel shows the variations in Γ during this period. The vertical columns separate the different flaring periods. Bottom: Γ vs. flux above E0 for flare C, D, and E.
Current usage metrics show cumulative count of Article Views (full-text article views including HTML views, PDF and ePub downloads, according to the available data) and Abstracts Views on Vision4Press platform.
Data correspond to usage on the plateform after 2015. The current usage metrics is available 48-96 hours after online publication and is updated daily on week days.
Initial download of the metrics may take a while.