Fig. 1
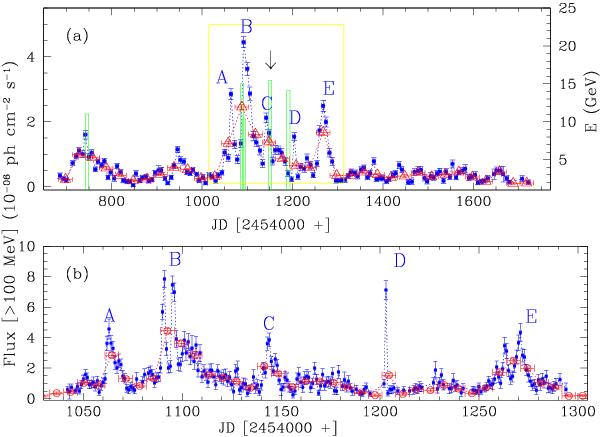
a) Weekly (blue circles) and monthly (red open symbols) averaged flux (E > 100 MeV) light curves of 3C 273 measured by Fermi-LAT since its launch. The green histogram represents the arrival time distribution of E > 10 GeV photons associated with 3C 273. The yellow box represents the high γ-ray flux activity period. b) One-day averaged light curve of the source over the high-activity period within the box shown at the top of the figure.
Current usage metrics show cumulative count of Article Views (full-text article views including HTML views, PDF and ePub downloads, according to the available data) and Abstracts Views on Vision4Press platform.
Data correspond to usage on the plateform after 2015. The current usage metrics is available 48-96 hours after online publication and is updated daily on week days.
Initial download of the metrics may take a while.