Fig. 8

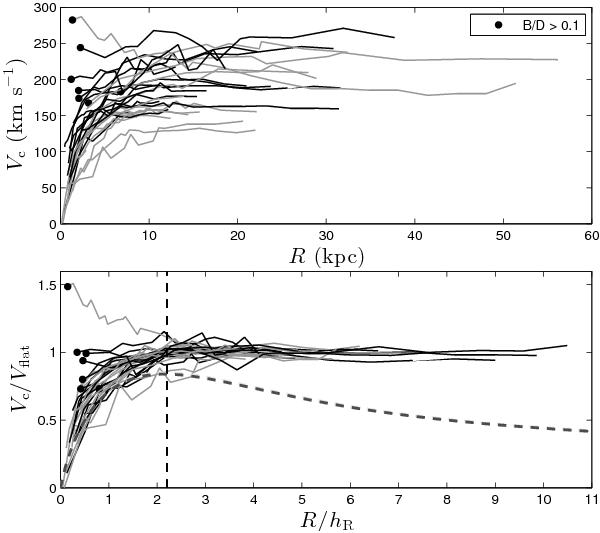
Observed rotation curves. Top: radius in kpc and amplitude in km s-1. Bottom: radius scaled by hR and amplitude scaled by the rotational velocity of the flat part of the rotation curve (Vflat). Galaxies with B/D > 0.1 have their first velocity measurement marked by a filled circle. In both panels, black and gray lines indicate high and low surface brightness, respectively. The thick, dashed line in the bottom panel indicates the rotation curve of a thin exponential disk with Vmax = 0.85Vc. R = 2.2hR is indicated with a vertical dashed line.
Current usage metrics show cumulative count of Article Views (full-text article views including HTML views, PDF and ePub downloads, according to the available data) and Abstracts Views on Vision4Press platform.
Data correspond to usage on the plateform after 2015. The current usage metrics is available 48-96 hours after online publication and is updated daily on week days.
Initial download of the metrics may take a while.


