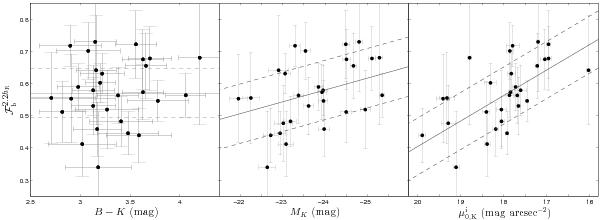
Fig. 14

Baryonic mass fraction measured at 2.2hR versus B − K color (left), absolute K-band magnitude (middle), and central surface brightness of the disk (right). Black dots with gray errorbars indicate measurements from individual galaxies. Black lines are linear fits to the data, showing that more luminous and higher-surface brightness galaxies have larger  . The lines in the left panel show the weighted average and scatter.
Current usage metrics show cumulative count of Article Views (full-text article views including HTML views, PDF and ePub downloads, according to the available data) and Abstracts Views on Vision4Press platform.
Data correspond to usage on the plateform after 2015. The current usage metrics is available 48-96 hours after online publication and is updated daily on week days.
Initial download of the metrics may take a while.


