Free Access
Fig. 19
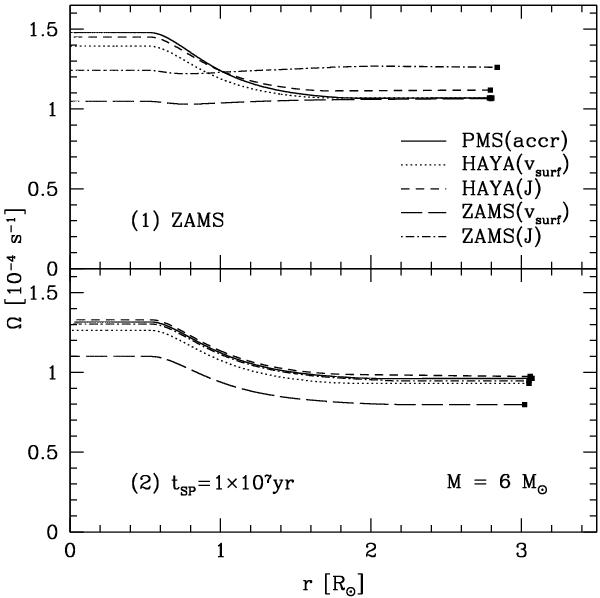
Rotation profiles on the main sequence for the five models of 6 M⊙, as described in Sect. 5. The upper panel shows the profiles on the ZAMS, while the lower panel shows the profiles 107 yr after the ZAMS (i.e. at around 15% of the time spent on the MS). Filled squares indicate the surface of the star.
Current usage metrics show cumulative count of Article Views (full-text article views including HTML views, PDF and ePub downloads, according to the available data) and Abstracts Views on Vision4Press platform.
Data correspond to usage on the plateform after 2015. The current usage metrics is available 48-96 hours after online publication and is updated daily on week days.
Initial download of the metrics may take a while.