Fig. 16
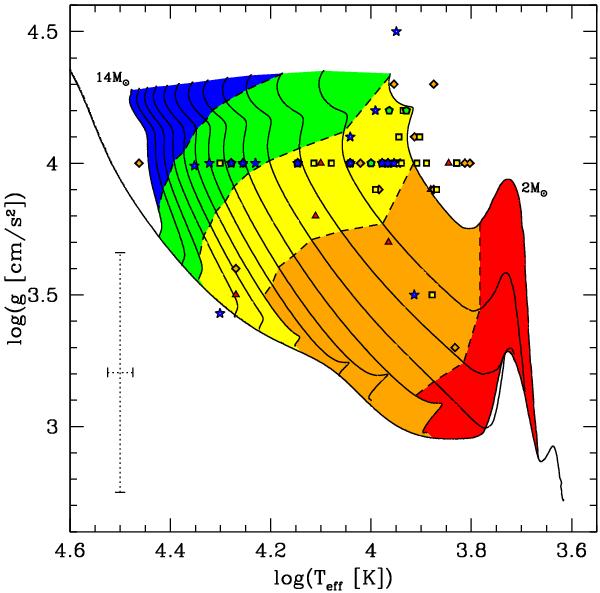
Diagram log Teff – log g. Solid lines are evolutionary tracks of the grid described in Sect. 3.3 (with the non-rotating birthline). Dashed lines are iso-velocities of 50, 100, 150 and 200 km s-1 of these models (from right to left). Dots indicate observations of Herbig Ae/Be stars with measured vsini from Alecian et al. (2013). The symbol and its colour depends on the value of w = vsini4/π: red triangles are used for w < 50 km s-1, orange diamonds for 50 km s-1<w< 100 km s-1, yellow squares for 100 km s-1<w< 150 km s-1, green pentagons for 150 km s-1<w< 200 km s-1 and blue stars for 200 km s-1<w< 250 km s-1. A mean error bar is displayed, which corresponds to the averaged error over the stars for which an error is given.
Current usage metrics show cumulative count of Article Views (full-text article views including HTML views, PDF and ePub downloads, according to the available data) and Abstracts Views on Vision4Press platform.
Data correspond to usage on the plateform after 2015. The current usage metrics is available 48-96 hours after online publication and is updated daily on week days.
Initial download of the metrics may take a while.