Fig. 11
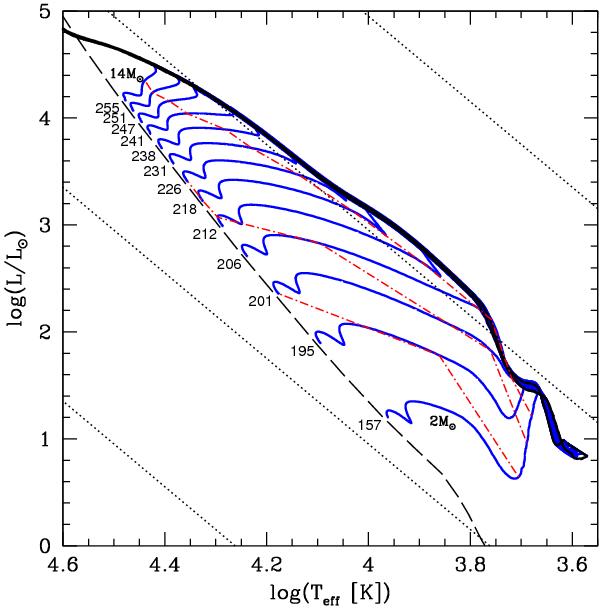
Grid of pre-MS models with MZAMS from 2 to 14 M⊙, by steps of 1 M⊙, with Ωini ∝ MZAMS (i.e. models described in Sect. 3.3, solid blue lines). Two birthlines (without rotation and with the higher Ωini) are plotted (solid black lines). The dashed line indicates the ZAMS of Ekström et al. (2012) and dotted lines correspond to iso-radius of 0.1, 1, 10 and 100 R⊙ from left to right. Equatorial surface velocities on the ZAMS are indicated (in km s-1) at the end of each track. Dot-dashed red lines indicate isochrones of 2 × 10⁵, 5 × 10⁵ and 2 × 10⁶ yr from top to bottom.
Current usage metrics show cumulative count of Article Views (full-text article views including HTML views, PDF and ePub downloads, according to the available data) and Abstracts Views on Vision4Press platform.
Data correspond to usage on the plateform after 2015. The current usage metrics is available 48-96 hours after online publication and is updated daily on week days.
Initial download of the metrics may take a while.