Fig. 1
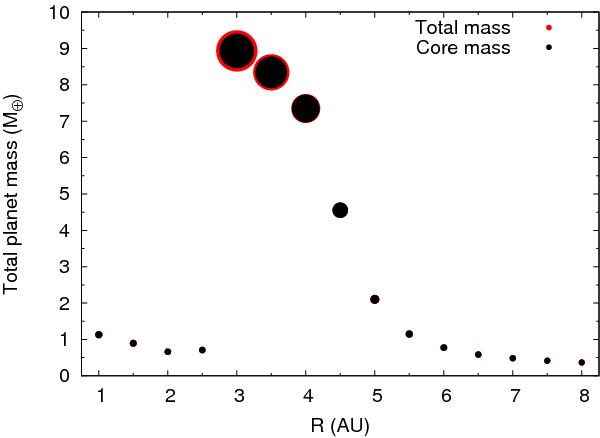
Total mass of the planets as a function of the distance from the central star at the end of the gas phase for a 0.15 M⊙ disk. The plot represents the simultaneous formation of several embryos separated by 0.5 AU between 1 AU and 8 AU. The most massive planet is located immediately beyond the snow line at 3 AU. The red point size represents in scale the total mass, while the black point size represents the core mass in the same scale. The adopted scale size is 1.25m, where m is the mass. Except for embryos located immediately beyond the snow line, the embryo core mass practically is the embryo total mass. A color version of this figure is available in the electronic version of the journal.
Current usage metrics show cumulative count of Article Views (full-text article views including HTML views, PDF and ePub downloads, according to the available data) and Abstracts Views on Vision4Press platform.
Data correspond to usage on the plateform after 2015. The current usage metrics is available 48-96 hours after online publication and is updated daily on week days.
Initial download of the metrics may take a while.