Free Access
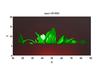
Fig. 5
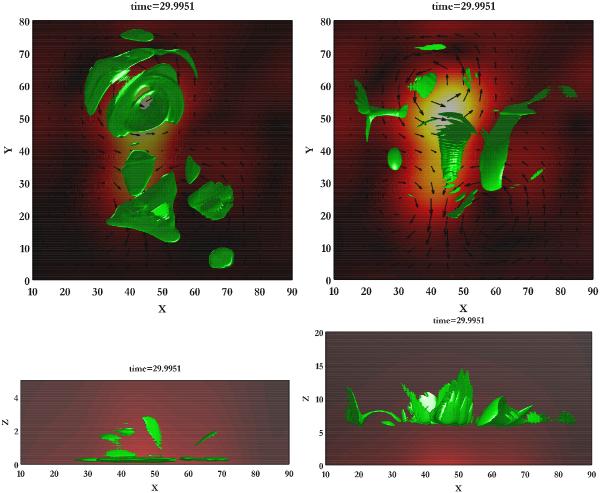
Isosurfaces of constant current density j = 5 (~10-3 A/m2) (left column) and of current carrier velocities j/n = 1 (or ~0.5 m/s) (right column) after 30 τA. The magnetic field strength is shown in red-orange, and the photospheric plasma flow velocities at the photospheric level are depicted by arrows.
This figure is made of several images, please see below:
Current usage metrics show cumulative count of Article Views (full-text article views including HTML views, PDF and ePub downloads, according to the available data) and Abstracts Views on Vision4Press platform.
Data correspond to usage on the plateform after 2015. The current usage metrics is available 48-96 hours after online publication and is updated daily on week days.
Initial download of the metrics may take a while.