Fig. 4
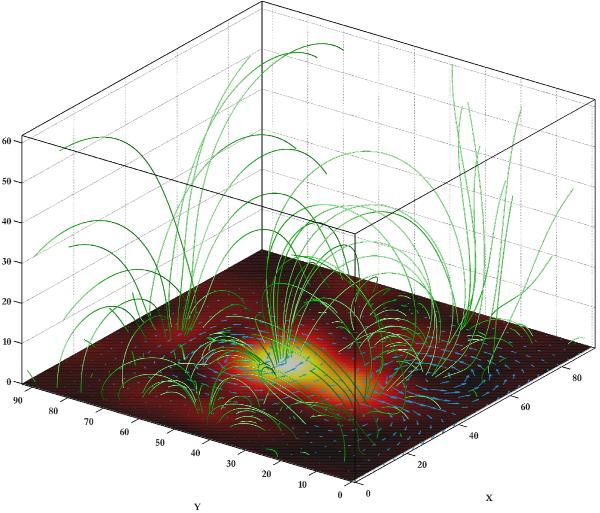
Illustration of the initial magnetic field extrapolated from the Fourier-filtered MDI magnetogram observations of the EUV bright point on December 19, 2006 at 22:17 UT. The magnetic field magnitude in the z = 0 plane is plotted in color, while the arrows in the z = 0 plane indicate the pattern of imposed photospheric motion.
Current usage metrics show cumulative count of Article Views (full-text article views including HTML views, PDF and ePub downloads, according to the available data) and Abstracts Views on Vision4Press platform.
Data correspond to usage on the plateform after 2015. The current usage metrics is available 48-96 hours after online publication and is updated daily on week days.
Initial download of the metrics may take a while.