Fig. 17
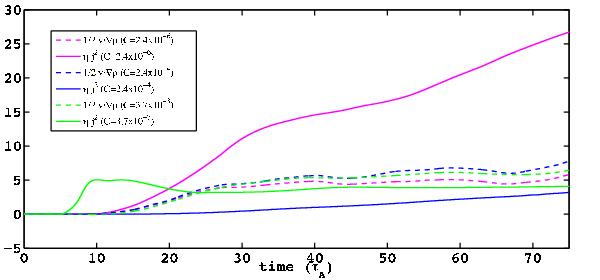
Temporal evolution of the source terms governing the thermal energy of the corona  (dashed lines) and ηj2 (solid lines) above the transition region for two uniform values of the critical switch-on thresholds corresponding to C = 2.4 × 10⁻⁴ (blue lines) and C = 2.4 × 10⁻⁶ (magenta lines) based on a coronal temperature of T = 106 K. For comparison, the reference case with a local coronal temperature dependent threshold value corresponding to C = 3.7 × 10⁻³ (green lines) is also shown.
Current usage metrics show cumulative count of Article Views (full-text article views including HTML views, PDF and ePub downloads, according to the available data) and Abstracts Views on Vision4Press platform.
Data correspond to usage on the plateform after 2015. The current usage metrics is available 48-96 hours after online publication and is updated daily on week days.
Initial download of the metrics may take a while.