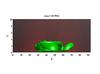
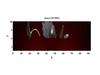
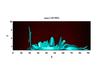
Fig. 11
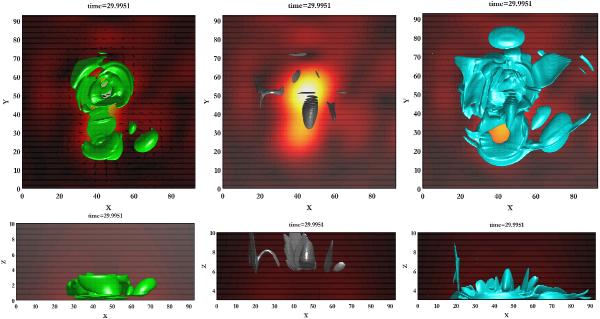
Isosurfaces showing (from left to right) regions of current density j ≥ 0.5 (8 × 10⁻⁵ A/m2), j/n ≥ 1 (i.e., a current carrier velocity vcc ≥ 0.5 m/s), and resistivity η ≥ 1 × 10⁻³ (30 Ωm) for the simulation run with a localized switch-on resistivity with ηeff = 0.01 after 30 τA. The magnetic field magnitude is shown in red-orange, and the flow at the photospheric boundary is illustrated by arrows.
Current usage metrics show cumulative count of Article Views (full-text article views including HTML views, PDF and ePub downloads, according to the available data) and Abstracts Views on Vision4Press platform.
Data correspond to usage on the plateform after 2015. The current usage metrics is available 48-96 hours after online publication and is updated daily on week days.
Initial download of the metrics may take a while.