Free Access
Fig. 6
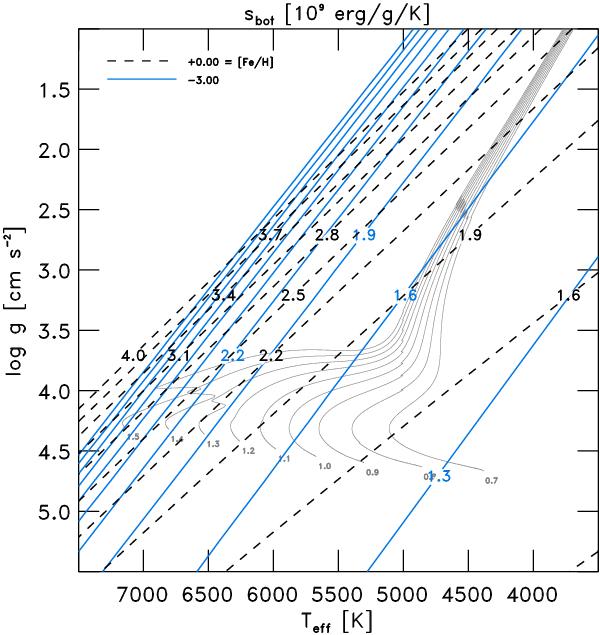
Lines of constant entropy of the adiabat sbot from 1.3 to 4.0 × 10¹³erg/g/K in steps of 0.3 × 10¹³erg/g/K and for [Fe/H] = −3.0 and 0.0 (blue solid and black dashed lines respectively) in the Kiel diagram. Additionally, we show evolutionary tracks for 0.7 to 1.5 M⊙ with solar metallicity (thin grey lines).
Current usage metrics show cumulative count of Article Views (full-text article views including HTML views, PDF and ePub downloads, according to the available data) and Abstracts Views on Vision4Press platform.
Data correspond to usage on the plateform after 2015. The current usage metrics is available 48-96 hours after online publication and is updated daily on week days.
Initial download of the metrics may take a while.