Fig. 16
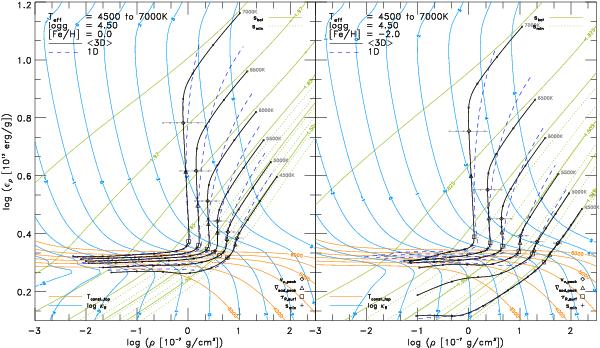
Mean internal energy against mean density for dwarf models (log g = 4.5) with [Fe/H] = 0.0 and − 2.0 (left and right respectively). The specific isocontours for the entropy sbot (green solid) and smin (green dotted), Rosseland opacity per volume, ρκRoss, (blue) and temperature T (orange) are underlayed. Moreover, the positions of entropy minimum smin (plus), optical surface (large square), vertical peak velocity  (diamonds) and maximum in ∇sad (triangle) are marked respectively. The amplitude of
  is indicated with horizontal bars with markings in 1 km s-1. We also included the 1D models with αMLT = 1.5 (blue dashed lines). The range in optical depth is shown from log τRoss = −5.0 to + 5.0 for each dex (small squares). However, we note that our simulations boxes are much deeper (⟨log τRoss⟩ ≈ + 7.5).
Current usage metrics show cumulative count of Article Views (full-text article views including HTML views, PDF and ePub downloads, according to the available data) and Abstracts Views on Vision4Press platform.
Data correspond to usage on the plateform after 2015. The current usage metrics is available 48-96 hours after online publication and is updated daily on week days.
Initial download of the metrics may take a while.