Fig. 15
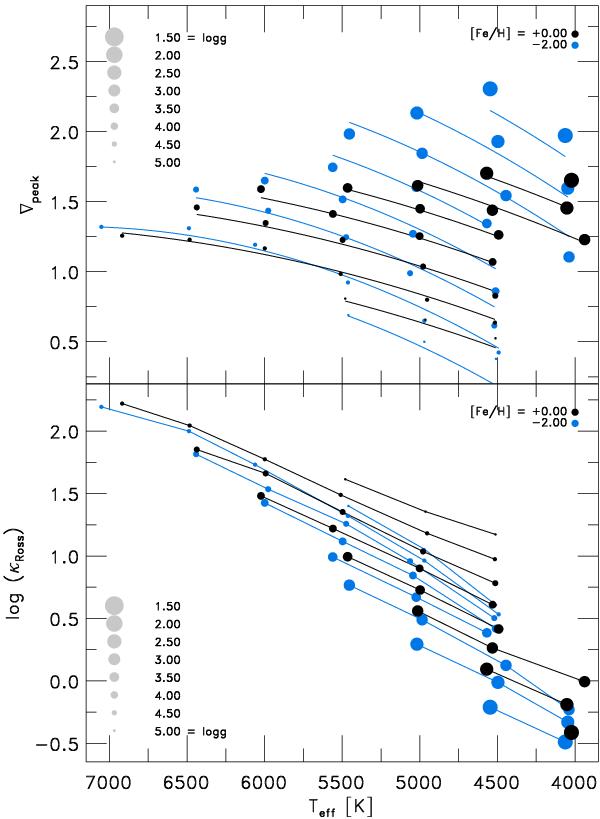
Overview of the maximum temperature gradient ∇peak (top panel) and Rosseland opacity κRoss taken at the height τRoss ≈ 3.0 (bottom panel) against Teff for [Fe/H] = −2.0 and 0.0 (blue and black respectively). Models with the same surface gravity are connected by their respective functional fits in the top panel (solid lines; see Appendix B).
Current usage metrics show cumulative count of Article Views (full-text article views including HTML views, PDF and ePub downloads, according to the available data) and Abstracts Views on Vision4Press platform.
Data correspond to usage on the plateform after 2015. The current usage metrics is available 48-96 hours after online publication and is updated daily on week days.
Initial download of the metrics may take a while.