Fig. 9
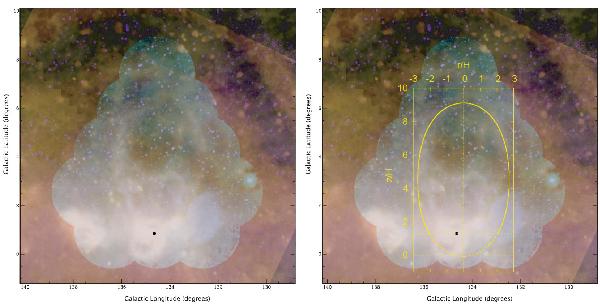
Left: color image of W4 (West et al. 2007) combining HI, Hα and infrared data. For comparison with our model, due to the faint structures and low contrast, the overlay is shown in a separate figure (right panel). The height of the star cluster above the plane is z0 = 35 pc, marked by the black dot. Right: Kompaneets bubble at  overlaid on the same image. The upper part of the contour fits quite well (solid line), while the part of the shell below the cluster is not seen in the observations (dotted line).
Current usage metrics show cumulative count of Article Views (full-text article views including HTML views, PDF and ePub downloads, according to the available data) and Abstracts Views on Vision4Press platform.
Data correspond to usage on the plateform after 2015. The current usage metrics is available 48-96 hours after online publication and is updated daily on week days.
Initial download of the metrics may take a while.