Fig. 10
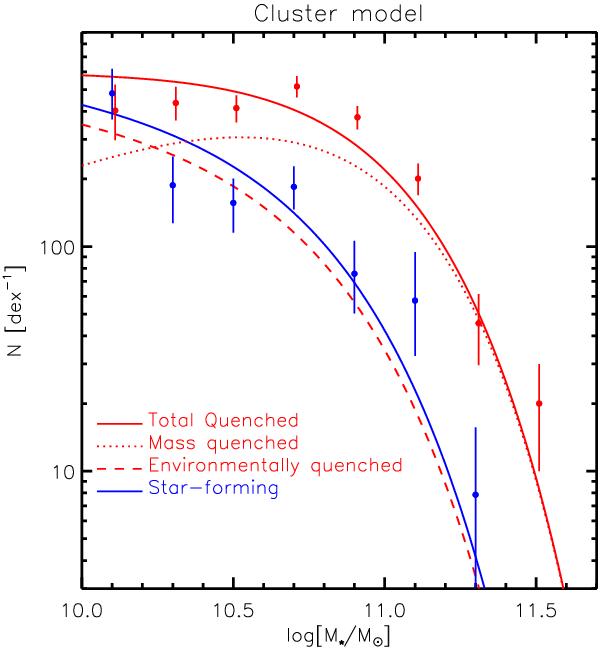
Cluster data, which were already given in Table 3, with the predictions from a simple quenching model based on Peng et al. (2010) in its most basic form, using UltraVISTA as a starting point. Mass quenching and environmental quenching are assumed to act independently. The blue Schechter function is the best fit to the star-forming galaxy population and the red solid line gives the best fit to the quiescent population. The red line is composed of a mass quenched population (dotted red line), and an environmentally quenched population (dashed line). This model needs 45% additional environmental quenching compared to the field to yield the best fit to the data. Note that the red points have been offset by 0.01 dex for better visibility.
Current usage metrics show cumulative count of Article Views (full-text article views including HTML views, PDF and ePub downloads, according to the available data) and Abstracts Views on Vision4Press platform.
Data correspond to usage on the plateform after 2015. The current usage metrics is available 48-96 hours after online publication and is updated daily on week days.
Initial download of the metrics may take a while.