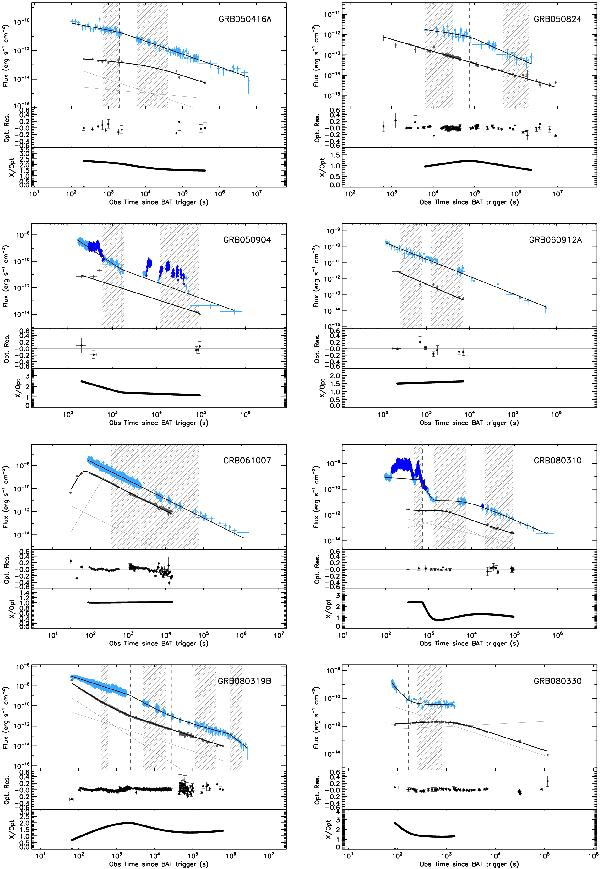
Fig. C.1

Comparison between optical and X-ray LCs. Top. Colored points: X-ray data. Dark color represents the excesses and light colors the continuum as calculated in M 13. Group A: blue/lightblue. Group B: red/orange. Group C: purple/magenta. Gray points: optical data. Black solid line: fit of the data. Gray solid line: components of the fit function used to fit the optical data. Middle. Ratio between the optical data and their fit function. The points have different colors when the optical data come from different filters. Bottom. Ratio between the X-ray flux and the optical flux. Hashed gray boxes: SED time intervals.
Current usage metrics show cumulative count of Article Views (full-text article views including HTML views, PDF and ePub downloads, according to the available data) and Abstracts Views on Vision4Press platform.
Data correspond to usage on the plateform after 2015. The current usage metrics is available 48-96 hours after online publication and is updated daily on week days.
Initial download of the metrics may take a while.


