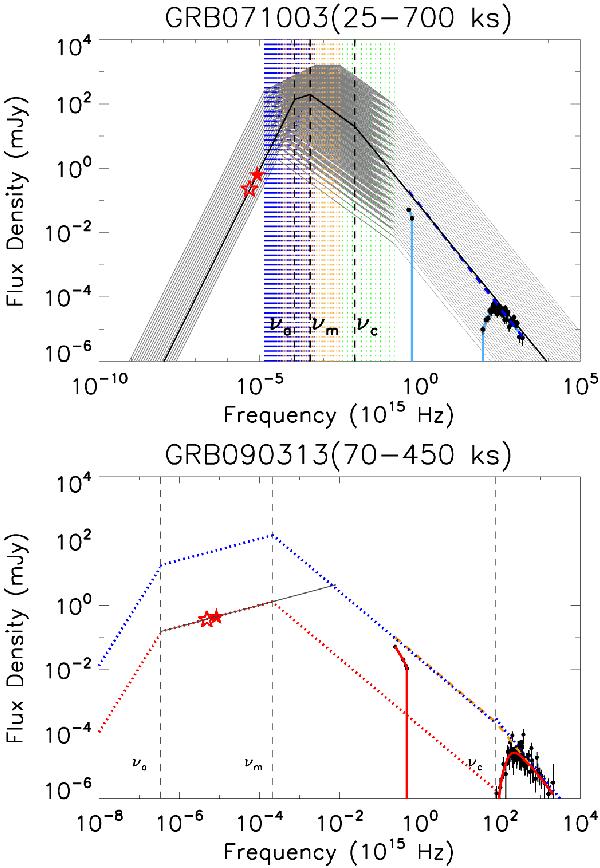
Fig. 19

Radio/optical/X-ray SEDs. Filled (empty) red star: radio data (upper limit). Black dots: optical and X-ray data. Upper panel: GRB 071003. Light blue solid line: optical/X-ray SED. Blue dashed line: power-law that fits the data. Black solid line: radio/optical/X-ray SED fit function. Black dashed line: the absorption frequency (νa), the synchrotron frequency (νm), and the cooling frequency (νc). Gray lines: radio/optical/X-ray SED tests with relative absorption frequencies (blue dashed lines), synchrotron frequencies (orange dashed lines), and cooling frequencies (green dashed lines). Lower panel: GRB 090313. Red solid line: the optical/X-ray SED fit function. Orange dashed line: broken power-law that fits the data. Blue dotted line: radio/optical/X-ray SED calculated considering νBR = νc. Red dotted line: radio/optical/X-ray SED calculated using the same characteristic frequencies as the red dotted line, but considering the normalization for the radio data. Gray dashed line: the absorption frequency (νa), the synchrotron frequency (νm), and the cooling frequency (νc).
Current usage metrics show cumulative count of Article Views (full-text article views including HTML views, PDF and ePub downloads, according to the available data) and Abstracts Views on Vision4Press platform.
Data correspond to usage on the plateform after 2015. The current usage metrics is available 48-96 hours after online publication and is updated daily on week days.
Initial download of the metrics may take a while.


