Fig. 4
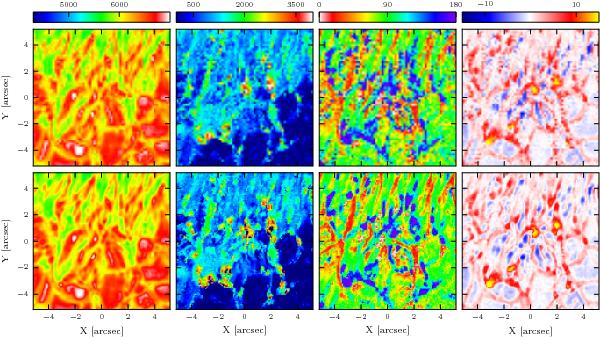
Selected region of spot 1, indicated by a black square in Fig. 1, at the native sampling of Hinode SP (top) and interpolated to 0  08/pixels prior to inversion (bottom). From left to right: temperature [K], magnetic field strength [G], inclination [°], and line-of-sight velocity [km s-1], all at 10log τc = 0. Clearly visible is the increased coherence of the structures and reduced overall noise in almost all parameters retrieved from the interpolated data.
Current usage metrics show cumulative count of Article Views (full-text article views including HTML views, PDF and ePub downloads, according to the available data) and Abstracts Views on Vision4Press platform.
Data correspond to usage on the plateform after 2015. The current usage metrics is available 48-96 hours after online publication and is updated daily on week days.
Initial download of the metrics may take a while.