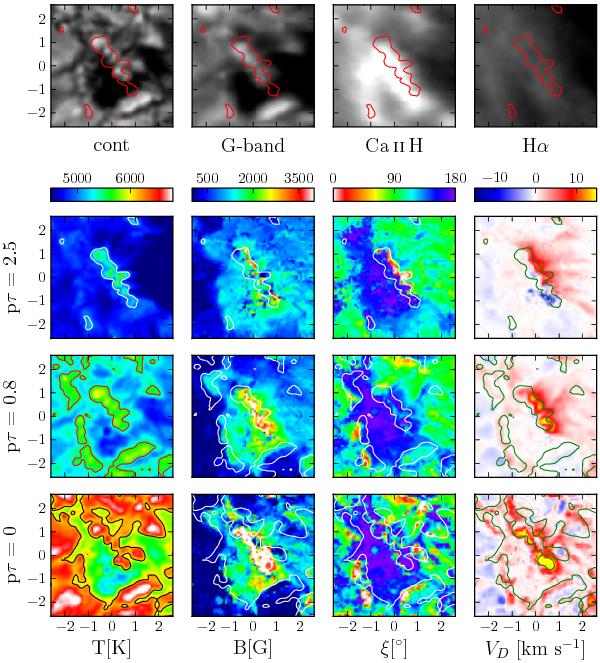
Fig. 12

Region from spot 2 (box (a) in Fig. 9). The top panel shows the continuum map of the inverted profiles (left), and the G-band, Ca ii H images from Hinode BFI, and Hα from Hinode NFI (right). The bottom three rows show from left to right: temperature [K], magnetic field strength [G], inclination [°], and line-of-sight velocity [km s-1], at different − 10log τc (i.e. pτ) levels. Iso-temperature contour lines of 5000 K at pτ = 2.5 are overplotted in the 1st and 2nd row, 5500 K at pτ = 0.8 in the 3rd row, and 6100 K at pτ = 0 in the bottom row. The temporal evolution of the region surrounding the downflow in the G band, Ca ii H and Hα (also shown in the top row) is shown in the attached movie.
Current usage metrics show cumulative count of Article Views (full-text article views including HTML views, PDF and ePub downloads, according to the available data) and Abstracts Views on Vision4Press platform.
Data correspond to usage on the plateform after 2015. The current usage metrics is available 48-96 hours after online publication and is updated daily on week days.
Initial download of the metrics may take a while.


