Fig. 1
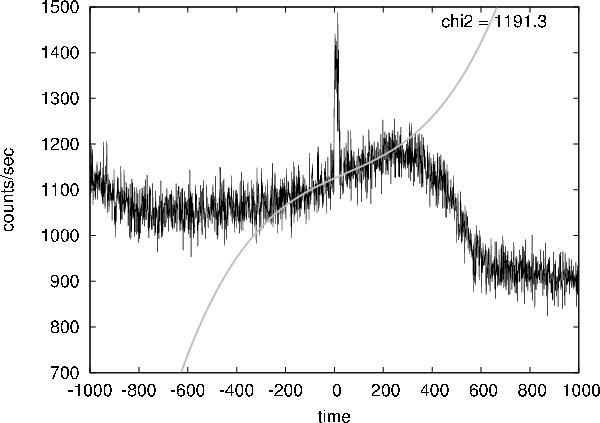
Lightcurve of the Fermi burst 091030.613 measured by the 3rd GBM-detector without any background filtering with 1-s bins. The grey line is a fitted polynomial function of time of order 3 for the ranges of [− 200:− 20] and [38:200] s, which does not seem to be a correct model for this whole background. Reduced chi-square statistics are given in the top right corner (Szécsi et al. 2012a).
Current usage metrics show cumulative count of Article Views (full-text article views including HTML views, PDF and ePub downloads, according to the available data) and Abstracts Views on Vision4Press platform.
Data correspond to usage on the plateform after 2015. The current usage metrics is available 48-96 hours after online publication and is updated daily on week days.
Initial download of the metrics may take a while.