Fig. 3
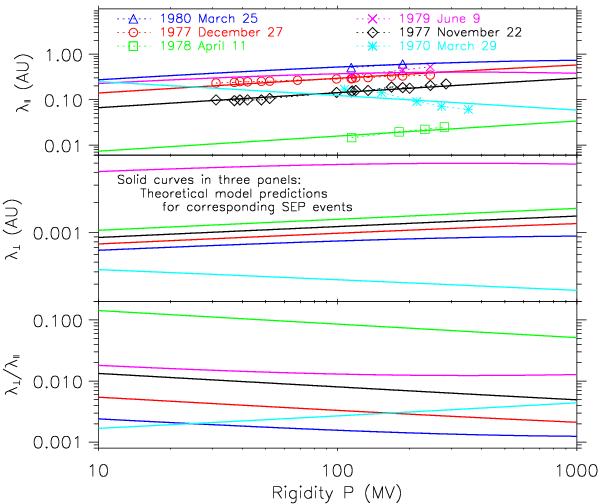
Fitting results of the theoretical model predictions to the observational determinations for the selected SEP events displayed in Fig. 2. The types of symbols (with colors) corresponding to different SEP events are the same as those in Fig. 2. The solid curves with different colors in three panels indicate the predictions of the theoretical model for the corresponding SEP events. Top: parallel mean free paths from the theoretical model in comparison with the observational determinations from spacecraft measurements of solar energetic protons in the SEP events. Middle: perpendicular mean free paths calculated from the corresponding parallel mean free paths. Bottom: ratios of the perpendicular to the parallel mean free paths.
Current usage metrics show cumulative count of Article Views (full-text article views including HTML views, PDF and ePub downloads, according to the available data) and Abstracts Views on Vision4Press platform.
Data correspond to usage on the plateform after 2015. The current usage metrics is available 48-96 hours after online publication and is updated daily on week days.
Initial download of the metrics may take a while.