Fig. 7
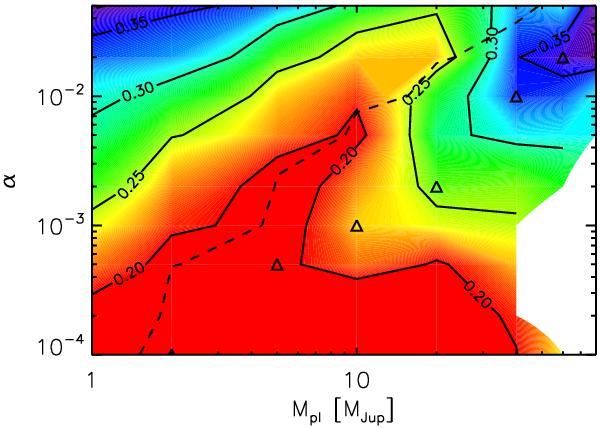
Shape of the disk wall as a function of planet mass and disk viscosity. Solid contours and colors denote the fitting parameter w from Eq. (1), which is w ∼0.33 to 0.40 for our best-fit radiative transfer models. The dashed line denotes a gap depth of 10-3. In the region below, the gap is deep enough to be consistent with the observed visibilities. Blue colors indicate rounder walls, red colors more vertical walls. The triangles indicate the models used for iterating on the pressure profile (see Sect. 5.3). The white regions contain models that neither converged nor finished 105 orbits due to excessive computing time.
Current usage metrics show cumulative count of Article Views (full-text article views including HTML views, PDF and ePub downloads, according to the available data) and Abstracts Views on Vision4Press platform.
Data correspond to usage on the plateform after 2015. The current usage metrics is available 48-96 hours after online publication and is updated daily on week days.
Initial download of the metrics may take a while.