Fig. 1
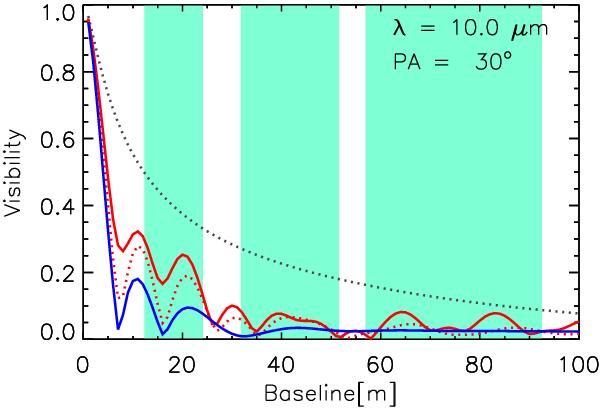
Visibilities versus baseline length for HD 100546 at 10 micron, along a position angle of 30 degree (the same as the 41 meter baselines). The colored lines show a very round wall in blue, a steeper wall in dotted red, a vertical wall in solid red, and a model without a gap in dotted gray. Note that in the model without a gap the emission is coming from much closer to the star, and visibilities are much higher. Indicated in green are the spatial frequency ranges probed by the MIDI spectra used in this paper (λ = 8....13 micron), displayed as effective baseline at ten micron (Baseline/λ × 10 μm).
Current usage metrics show cumulative count of Article Views (full-text article views including HTML views, PDF and ePub downloads, according to the available data) and Abstracts Views on Vision4Press platform.
Data correspond to usage on the plateform after 2015. The current usage metrics is available 48-96 hours after online publication and is updated daily on week days.
Initial download of the metrics may take a while.