Fig. 5
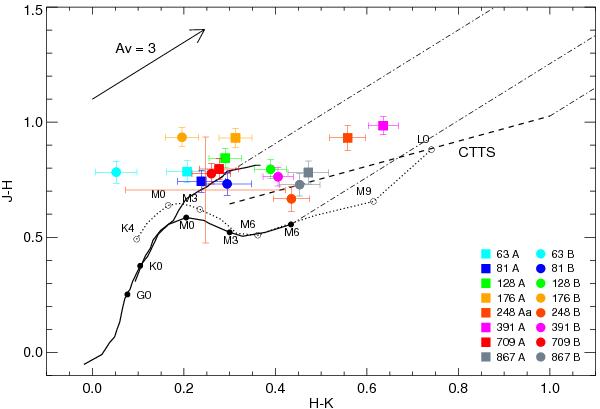
Locus of the components of the ONC binaries in a J − H/H − K color–color diagram. Solid lines are the locus of photospheric dwarf and giant colors from Bessell & Brett (1988), while in dotted lines are shown the colors of young stellar photospheres of given spectral type in the range K4–L0 (Luhman et al. 2010). The dashed line is the CTTS locus from Meyer et al. (1997). The data point with large uncertainties is JW 248 Ab. All data are in the MKO photometric system.
Current usage metrics show cumulative count of Article Views (full-text article views including HTML views, PDF and ePub downloads, according to the available data) and Abstracts Views on Vision4Press platform.
Data correspond to usage on the plateform after 2015. The current usage metrics is available 48-96 hours after online publication and is updated daily on week days.
Initial download of the metrics may take a while.