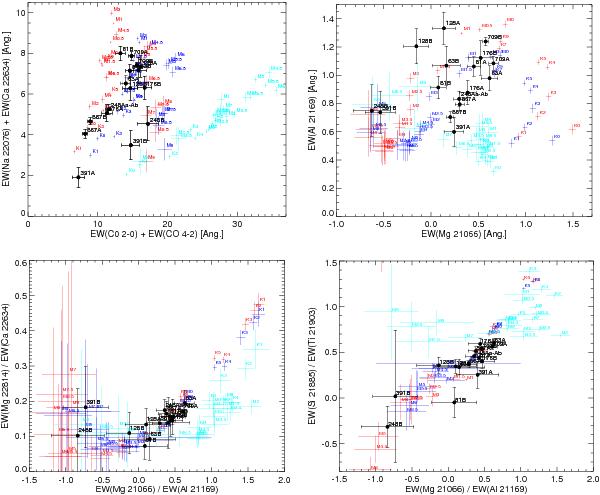
Fig. A.1

Locus of the binary components in several equivalent width diagnostic plots. These plots are the Na 22076 μm + Ca 2.2634 μm versus CO(4–2) + CO(2–0) (upper right), Al 2.1169 μm versus Mg 2.1066 μm (upper left), Mg 2.2814/Ca 2.2634 μm versus Mg 2.1066/Al 2.1169 μm (lower left), and Si 2.1885/Ti 21903 μm versus Mg 2.1066/Al 2.1169 μm (lower right). The ONC binary components (in black) are labeled, as well as the spectral type of the dwarf (red), giant (turquoise), and intermediate-gravity (blue) spectral type templates.
Current usage metrics show cumulative count of Article Views (full-text article views including HTML views, PDF and ePub downloads, according to the available data) and Abstracts Views on Vision4Press platform.
Data correspond to usage on the plateform after 2015. The current usage metrics is available 48-96 hours after online publication and is updated daily on week days.
Initial download of the metrics may take a while.


