Fig. 14
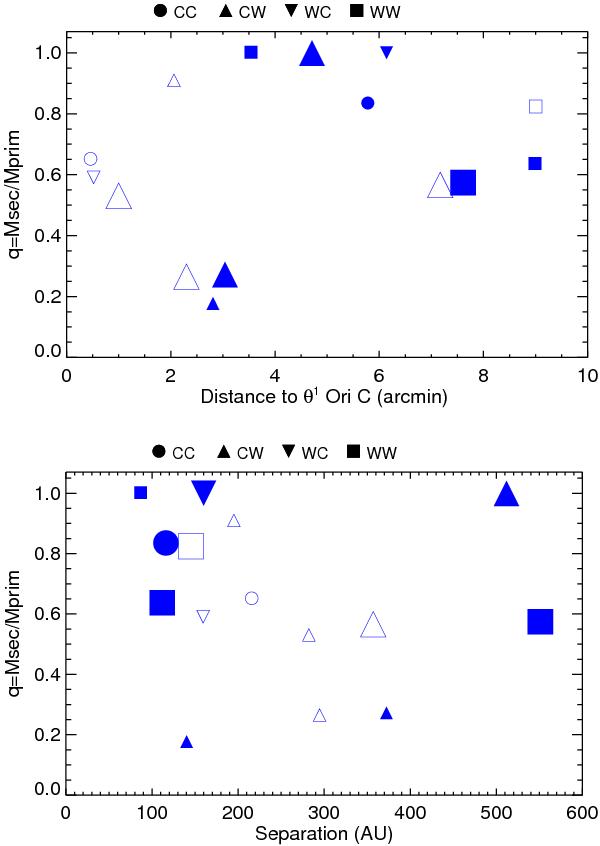
Upper plot: mass ratio vs. the distance from θ1 Ori C with T Tauri types (CTTS and WTTS). Small symbols denote systems with separation <220 AU and large symbols separation >220 AU. Lower plot: mass ratio vs. binary separation with T Tauri types. Small symbols correspond to systems at a distance to θ1 Ori C < 4 arcmin and large symbols a distance >4 arcmin. As in Fig. 13 open symbols denote ONC systems from D12. Mass ratios derived from S00 tracks are plotted.
Current usage metrics show cumulative count of Article Views (full-text article views including HTML views, PDF and ePub downloads, according to the available data) and Abstracts Views on Vision4Press platform.
Data correspond to usage on the plateform after 2015. The current usage metrics is available 48-96 hours after online publication and is updated daily on week days.
Initial download of the metrics may take a while.