Fig. 7
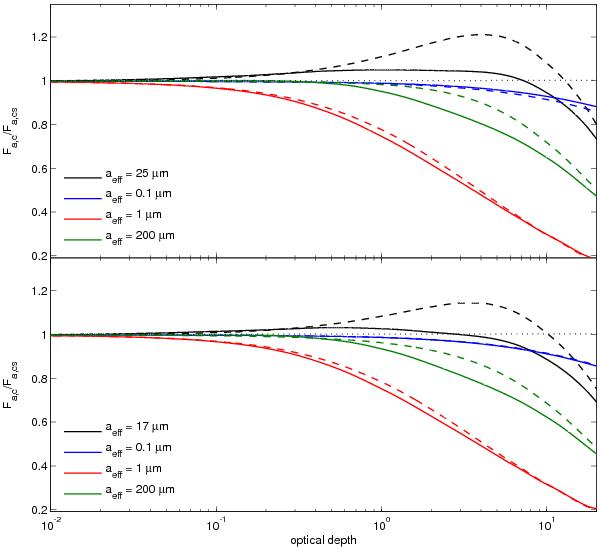
Ratios Fa,c/Fa,cs as a function of optical depth τ for an effective temperature of Teff = 3000 K and the two different atmospheric temperatures: Ta = 160 K (upper diagram) and Ta = 273 K (lower diagram). Results are shown for different size distributions in each diagram: aeff = 25 μm (black line, upper diagram), aeff = 17 μm (black line, lower diagram), aeff = 0.1 μm (red line), aeff = 1.0 μm (blue line), and aeff = 200 μm (green line). Calculations using DISORT (two-stream methods) are denoted by solid lines (dashed lines).
Current usage metrics show cumulative count of Article Views (full-text article views including HTML views, PDF and ePub downloads, according to the available data) and Abstracts Views on Vision4Press platform.
Data correspond to usage on the plateform after 2015. The current usage metrics is available 48-96 hours after online publication and is updated daily on week days.
Initial download of the metrics may take a while.