Free Access
Fig. 1
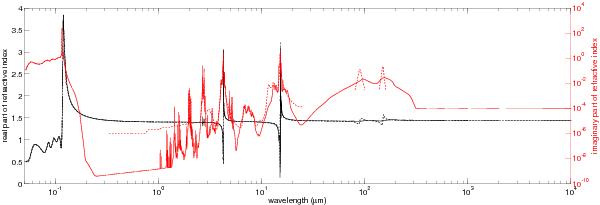
Real part (black line) and imaginary part (red line) of the refractive index of CO2 ice. The solid lines indicate the data published by Hansen (1997, 2005), the dashed lines mark the data compilation from Warren (1986).
Current usage metrics show cumulative count of Article Views (full-text article views including HTML views, PDF and ePub downloads, according to the available data) and Abstracts Views on Vision4Press platform.
Data correspond to usage on the plateform after 2015. The current usage metrics is available 48-96 hours after online publication and is updated daily on week days.
Initial download of the metrics may take a while.