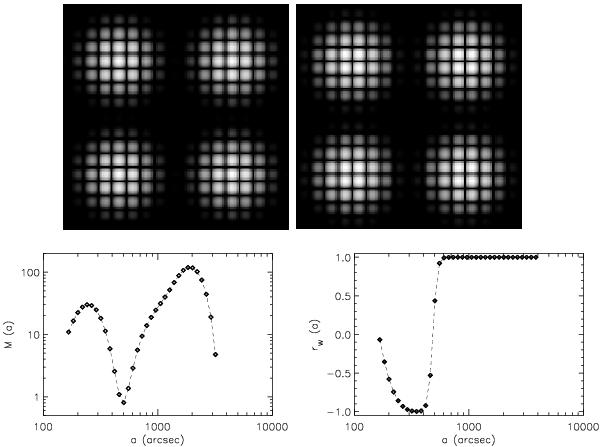
Fig. 4

Artificial example of a scale-by-scale wavelet cross-correlation analysis. Top:two different mock maps before the wavelet decomposition. The maps show four large-scale spots made by small-scale spots. The large-scale spots in the two maps slightly differ in size (6 rows and columns in the right panel, 5 rows and columns in the left panel). As they are centered at the same location, the small-scale spots are shifted with respect to each other. Bottom left: wavelet spectra (they are identical for both maps), bottom right: wavelet cross-correlation function.
Current usage metrics show cumulative count of Article Views (full-text article views including HTML views, PDF and ePub downloads, according to the available data) and Abstracts Views on Vision4Press platform.
Data correspond to usage on the plateform after 2015. The current usage metrics is available 48-96 hours after online publication and is updated daily on week days.
Initial download of the metrics may take a while.


