| Issue |
A&A
Volume 556, August 2013
|
|
|---|---|---|
| Article Number | L2 | |
| Number of page(s) | 4 | |
| Section | Letters | |
| DOI | https://doi.org/10.1051/0004-6361/201322072 | |
| Published online | 26 July 2013 | |
Coronal magnetic topology and the production of solar impulsive energetic electrons
1
School of Astronomy and Space Science, Nanjing University,
210093
Nanjing,
PR China
e-mail: This email address is being protected from spambots. You need JavaScript enabled to view it.
2
Key Laboratory for Modern Astronomy and Astrophysics (Nanjing
University), Ministry of Education,
210093
Nanjing, PR
China
3
Key Laboratory of Solar Activity, The National Astronomical
Observatories, CAS, 20A Datun Road,
Chaoyang District, 100012
Beijing, PR
China
Received: 13 June 2013
Accepted: 10 July 2013
Abstract
We investigate two candidate solar sources or active regions (ARs) in association with a solar impulsive energetic electron (SIEE) event on 2002 October 20. The solar particle release (SPR) times of SIEEs are derived by using their velocity dispersion with consideration of the instrumental effect. It is found that there are double electron injections at the Sun. The low-energy (≲13 keV) electron injection coincides with a C6.6 flare in AR10154 and is accompanied with prominent type III radio bursts rather than a stronger M1.8 flare in AR10160. The M1.8 flare produces, however, faint type III radio bursts. Electrons of ~25 to ~300 keV are released ~9 min later when a jet-like CME travels to ~2.6 solar radii. We further examine the coronal magnetic configurations above the two ARs based on the potential field source surface (PFSS) model. It is found that open field lines, rooted in AR10154 and well connected to the Earth, provide escaping channels for energetic electrons. Only a small portion of magnetic fields are opened above AR10160, being responsible for the faint type III radio bursts. These lines are, however, not well connected, making it impossible for SIEEs detection by near-Earth spacecraft. The results appear to establish a physical link between coronal magnetic topology, formation of type III radio bursts, and production of SIEEs.
Key words: acceleration of particles / Sun: magnetic topology / Sun: flares / Sun: coronal mass ejections
© ESO, 2013
1. Introduction
Solar impulsive energetic electrons (SIEEs) are one population of solar energetic particles (SEPs) produced by the rapid release of magnetic energy on the Sun. In situ observations (Lin 1985; Reames 1999) show that SIEEs are in close association with type III radio bursts. In some cases, the SIEEs are accompanied by enrichment of low-energy 3He (e.g. 3He/4He ≥ 0.01) and enhancement of heavy ions (e.g. Fe). Traditionally, it was believed that solar flares rather than coronal mass ejections (CMEs) are the acceleration sources of impulsive SEPs, even though some unusual cases appear to be associated with narrow or jet-like CMEs (Wang et al. 2006a; Pick et al. 2006). Recently, Wang et al. (2012) carried out a statistical survey of electron events over one solar cycle and found that only ~35% of them are related to a reported flare, as compared to that of ~60% that are related to a CME and to that of ~50% for which these CMEs are narrow.
The narrow or jet-like CMEs can be explained by the interchange reconnection (Shibata et al. 1994; Shimojo & Shibata 2000) for which expanding loops (closed fields) reconnect with large scale open magnetic fields. Plasma jets are produced upward from the reconnection region along the open field lines and appear to be narrow CMEs extending to a few solar radii (Rs) in white light (WL) observations. Meanwhile, charged particles are accelerated and escape to the interplanetary space following the open field lines. Therefore, coronal magnetic topology indeed plays an important role in triggering solar eruptions and guiding energetic particles. Several authors (Wang et al. 2006b; Pick et al. 2006; Rust et al. 2008; Mason et al. 2009; Li et al. 2010, 2011) have presented magnetic flux tubes rooted in solar active regions (ARs) that made it possible for energetic particles to easily escape from acceleration sites and quickly reach the Earth .
With this insight, it is necessary to examine the possibilities of solar sources or ARs in producing SEPs under different conditions of coronal magnetic fields. The impulsive SEP event that occurred on 2002 October 20 gives us an excellent opportunity to carry out this cross disciplinary study. This event had been partially discussed by several other authors (Wang et al. 2006b; Pick et al. 2006; Wang et al. 2011). Unlike previous studies, we derive the solar particle release (SPR) times of SIEEs by considering the instrumental effect and find double injections of electrons at the Sun. We further investigate two candidate ARs that are potential sources of SIEEs and reveal a physical link between coronal magnetic topology, formation of type III radio bursts, and production of SIEEs.
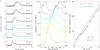 |
Fig. 1 Panel a) Electron intensity profiles detected by Wind/3DP/SSTs (27–310 keV) on 2002 October 20. The black lines indicate the original fluxes, and the colored lines show fluxes after correction for scatter-out electrons. Panel b) Electron intensity profiles detected by Wind/3DP/EESAs (1.3–19 keV). Panel c) Onset times of electron fluxes as a function of inverse velocities. The red line indicates a linear fit to electrons above ~25 keV, and the blue one shows a fit below 13 keV. |
2. In situ particle measurements
We use particle data from two near-Earth spacecrafts, Wind and Advanced Composition Explorer (ACE). The electron data have been obtained with the three-dimensional plasma and energetic particles instrument (3DP; Lin 1995) onboard the Wind. The electrostatic analyzers (EESAs) detect electrons from ~0.5 to 28 keV, and the solid-state telescopes (SSTs) detect from 27 to 517 keV. The ACE Ultra Low Energy Isotope Spectrometer (ULEIS; Mason et al. 1998) provides elemental and isotropic measurements of He – Ni from ~0.02 to 10 MeV nucleon-1.
For Wind/3DP/SSTs, a laboratory calibration shows that a proportion of incident electrons will scatter back out of each detector before fully depositing their original energy and produce secondary particles that contaminate lower energy channels. This leads to erroneous results when studying the electron release from the Sun, if the contamination is not considered (Wang 2009). An empirical method is applied here to correct the instrumental contamination (for more details, refer to Sun 2012; Li et al. 2013).
Figure 1 (panel a) presents the electron intensity profiles observed by Wind/3DP/SSTs in the energy range of 27 to 310 keV before (black lines) and after (color lines) correction on 2002 October 20. The velocity dispersion (onset times are later for lower energies) of in situ electrons is clearly shown, and the intensity maxima is found to be within 15 min from the onset time of in situ electrons. These indicate both solar impulsive injection and interplanetary scatter-free propagation of SIEEs. Figure 1 (panel b) also presents the intensity profiles of low-energy (1.3−19 keV) electrons observed by Wind/3DP/EESAs. An earlier event occurred a few hours before. It is counted in low-energy channels.
A linear fit to the velocity dispersion has been commonly applied to study the SPR time of SIEEs (Lin et al. 1981; Reames et al. 1985; Krucker et al. 1999), assuming scatter-free propagation in interplanetary medium (IPM) for the first arriving electrons. The SPR time of electrons with energy En can be expressed as TSPR(En) = Tonset(En) − L/v(En), where Tonset(En) is the onset time of the intensity increase at 1 AU for the energy channel number n, L is the interplanetary magnetic field (IMF) path length from solar release site to the near-Earth space, and v(En) is the electron velocity of the corresponding energy channel.
We can then plot Tonset(En) versus c/v(En), as shown in Fig. 1 (panel c). It leads to a linear fit, where the y-axis intercept corresponds to the SPR time and the slope to the IMF path length. Note that the linear fit to the low-energy (≲13 keV) channels leads to the electron SPR time being 14:02 ± 00:02 UT, while whose for high-energy (~25 to ~300 keV) are 14:11 ± 00:01 UT. This suggests that there exist double injections for two species of electrons. More evidence is that both fits show similar slopes, indicating the two species of electrons travel along the same IMF path length of 1.03 ± 0.02 AU. This is slightly smaller than the nominal IMF line length of ~1.06 AU, derived from the solar wind speed of ~650 km s-1 during this event.
This event is in association with a variety of ion emissions, especially the enrichment of 3He. Figure 2 shows the intensity profiles of 3He (bottom panel) and ratios of 3He/4He (top panel), as observed by the ACE/ULEIS. It shows again clear velocity dispersion, and the maximum 3He/4He ratio is ~1.0 at 0.32−0.64 MeV nucleon-1. Both are the typical features of an impulsive SEP event. Note that the extrapolated low-energy ion injection at the Sun starts at 14:47 ± 00:33 UT (Pick et al. 2006), and the injection for protons is at 14:12 ± 00:05 UT (Klein & Posner 2005), which is more compatible with the injection of the high-energy (~25 to ~300 keV) electrons rather than those of low-energy (≲13 keV).
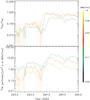 |
Fig. 2 Intensity profiles of 3He (bottom panel) and ratios of 3He/4He (top panel) observed by ACE/ULEIS. The energy ranges for the blue, red, and yellow lines are 0.06–0.16, 0.16–0.32, and 0.32–0.64 MeV nucleon-1, respectively. |
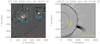 |
Fig. 3 Left panel: SOHO/EIT 195 Å image with a previous one subtracted. Red contour lines indicate the RHESSI HXR source in 25−50 keV at 14:22:20 UT. Blue boxes mark AR10154 and AR10160, respectively. Black arrow marks the dimming region. Right panel: Jet-like CME observed by SOHO/LASCO WL image with a previous one subtracted. Yellow contour lines indicate the NRH radio source in 164 MHz at 14:12:09 UT. |
3. Solar observations and coronal magnetic topologies
To clarify the acceleration sources of the SIEEs, especially for the two species of electrons, we combine solar observations by two instruments onboard the Solar and Heliospheric Observatory (SOHO). Figure 3 shows the 195 Å difference image with a previous one subtracted from the Extreme-ultraviolet Imaging Telescope (EIT; Delaboudinière et al. 1995) and the WL difference image from the Large Angle and Spectrometric Coronagraph (LASCO; Brueckner et al. 1995). It is clear that two ARs relating to solar flares and a jet-like CME are identified to be the candidate acceleration sources of SIEEs.
AR10154 was positioned at S14W62 on the Sun and produced a C6.6 flare. The difference image in 195 Å clearly shows a dimming region after the solar eruption (Fig. 3, left panel). Note that the dimming is temporally and spatially in accordance with a jet-like CME that extends to several Rs as shown by the WL difference image (right panel). Moreover, the jet-like CME is aligned with the 164 MHz radio source that is observed by the Nançay Radioheliogragh (NRH). With a larger active area, AR10160, was positioned at S06W25 and produced an C1.7 and an M1.8 flare. The M1.8 flare is associated with a contoured hard X-ray (HXR) source (left panel), which is reconstructed from the Reuven Ramaty High Energy Solar Spectroscopic Imager (RHESSI; Lin et al. 2002). It was, however, not associated with a reported CME, indicating that the flare was confined and failed to produce mass eruptions.
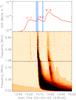 |
Fig. 4 GOES SXR flux in 1–8 Å and the Wind/WAVES radio dynamic spectra in the frequency range of 20 kHz to 14 MHz. Blue dashed lines mark the SPR times of low-energy (≲13 keV) and high-energy (~25 to ~300 keV) electrons, respectively. Line thickness indicates the error estimate. |
Figure 4 shows the three successive solar flares recorded by the GOES soft X-ray (SXR) in 1−8 Å and the accompanied three groups of type III radio bursts observed by the Wind/WAVES radio spectrograms in the frequency range from 20 kHz to 14 MHz. Two vertical dashed lines mark the SPR times (plus 8.3 min with respect to electromagnetic emission) of the electrons with energies ≲13 keV and those ranging from ~25 to ~300 keV. It is found that the low-energy electrons injection coincides with the C6.6 flare in AR10154 and the prominent type III radio bursts, rather than the M1.8 flare from the relatively strong AR10160 that produced faint type III radio bursts. The high-energy electrons are, however, released ~9 min later, when the jet-like CME travels to ~2.6 Rs, according to the LASCO C2 observations (see Fig. 3, right panel).
The high flux of in situ electrons and the prominent type III radio bursts may indicate that a great portion of open field lines are rooted in AR10154, while closed field lines dominate above AR10160. Therefore, it is necessary to examine the magnetic field configurations above the two ARs. We trace the coronal magnetic field lines, rooted in the two ARs and extended to 2.5 Rs, by applying the potential field source surface (PFSS) model (Schrijver & DeRosa 2003). We then estimate the connection longitudes of the spiral IMF lines that connect the Sun with the Earth. This is based on the equation φ ≃ ωr/u, where ω is the angular speed of solar rotation, r is the radial Sun-Earth distance, and u is the solar wind speed. Figure 5 shows the extrapolated coronal magnetic topologies above AR10154 and AR10160 with open field lines marked in red and closed ones in brown, respectively. The connection longitudes with uncertainties of ± 10° are indicated by black lines.
It is evident that open field lines dominate above AR10154. Therefore, low-energy (≲13 keV) electrons accelerated by the C6.6 flare can easily escape from the low corona to interplanetary space and generate the prominent type III radio bursts. This agrees with the Langmuir waves that scatter to produce the type III radio emission that were observed simultaneously with the arrival of ~2–10 keV electrons at 1 AU (Ergun et al. 1998). The open field lines are well connected to the IMF lines that connect the Sun with the Earth, facilitating electrons to quickly reach the spacecraft. Note that these lines are also aligned with the jet-like CME (see Fig. 3, right panel), which may be responsible for the production of high-energy (~25 to ~300 keV) electrons. Whereas only a small portion of open field lines are rooted in AR10160. This explains why the stronger M1.8 flare produces relatively faint type III radio bursts. These lines are, however, not well connected to Earth, making it impossible for SEPs detection by near-Earth spacecraft.
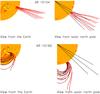 |
Fig. 5 PFSS modeled coronal magnetic configurations above AR10154 and AR10160, respectively. The red lines mark the open field lines and brown lines mark the closed ones. Black lines mark the connection longitudes where the well connected IMF lines intersect the solar source surface. |
4. Summary and discussion
We re-investigate the 2002 October 20 SEP event by combining in situ particle measurements, remote sensing solar observations, and the magnetic field extrapolations. Data analysis leads to the following results and our main conclusions: (1) The SPR time of low-energy (≲13 keV) electrons is derived as 14:02 ± 00:02 UT, which coincides with a C6.6 flare in AR10154. These electrons are probably the source of the prominent type III radio bursts. (2) Electrons of ~25 to ~300 keV are released ~9 min later, when the jet-like CME travels to ~2.6 Rs. (3) The open field lines, rooted in AR10154, are aligned with the jet-like CME and well connected with the IMF lines that connect the Sun with the Earth, providing escape channels for energetic electrons. (4) Only a small portion of magnetic fields are opened above AR10160, which is responsible for the faint type III radio bursts. These lines are, however, not well connected. Therefore, no SIEEs from AR10160 are detected by near-Earth spacecraft. (5) A physical link is evident between the coronal magnetic topology, the formation of type III radio bursts, and the production of SIEEs.
The time delay of high-energy electron injection at the Sun has been reported by several authors (Krucker et al. 1999; Haggerty & Roelf 2002; Wang et al. 2006a). For instance, Wang et al. (2006a) found two distinct injections in three impulsive electron events: Electrons of ~0.4−9 keV are released earlier than type III radio emission, while the injection of ~13−300 keV electrons starts when the associated CME reaches ~1 to 6 Rs. The delayed injection of high-energy electrons can be due either to the acceleration by CME-driven shocks or to the propagation effects in the IPM. Wang et al. (2011) further studied the pitch-angle distributions of in situ electrons and found that high-energy electrons experience obvious pitch-angle scattering. This seems to support the propagation effects in the IPM. However the high-energy electron injection is derived to be compatible with the low-energy ions, especially for protons in the present study. We, therefore, cannot ignore the role of shock waves associated with CMEs in producing high-energy electrons. The low-energy electrons from flare sites can serve as seed particles for further acceleration by CME-driven shocks.
Acknowledgments
We thank the Wind, ACE, GOES, SOHO, and RHESSI spacecraft, as well as the Nançay Radioheliogragh for providing observational data. This work is supported by 985 project of Nanjing University and Advanced Discipline Construction Project of Jiangsu Province. C. Li would like to acknowledge the Natural Science Foundation (BK2012299) of Jiangsu province, the Ph.D. programs foundation of Ministry of Education of China (20120091120034), and the Technology Foundation for Selected Overseas Chinese Scholar, Ministry of Personnel of China. X. Wang is supported by National Natural Science Foundation of China (NSFC 41074123).
References
- Brueckner, G. E., Howard, R. A., Koomen, M. J., et al. 1995, Sol. Phys., 162, 357 [NASA ADS] [CrossRef] [Google Scholar]
- Delaboudinière, J. -P., Artzner, G. E., Brunaud, J., et al. 1995, Sol. Phys., 162, 291 [NASA ADS] [CrossRef] [Google Scholar]
- Ergun, R. E., Larson, D., Lin, R. P., et al. 1998, ApJ, 503, 435 [NASA ADS] [CrossRef] [Google Scholar]
- Haggerty, D., & Roelof, E. 2002, ApJ, 579, 841 [NASA ADS] [CrossRef] [Google Scholar]
- Klein, K. L., & Posner, A. 2005, A&A, 438, 1029 [NASA ADS] [CrossRef] [EDP Sciences] [Google Scholar]
- Krucker, S., Larson, D. E., Lin, R. P., & Thompson, B. J. 1999, ApJ, 519, 864 [NASA ADS] [CrossRef] [Google Scholar]
- Li, C., Owen, C. J., Matthews, S. A., Dai, Y., & Tan, Y. H. 2010, ApJ, 720, L36 [NASA ADS] [CrossRef] [Google Scholar]
- Li, C., Matthews, S. A., van Driel-Gesztelyi, L., Sun, J., & Owen, C. J. 2011, ApJ, 735, 43 [NASA ADS] [CrossRef] [Google Scholar]
- Li, C., Firoz, K. A., Sun, L. P., & Miroshnichenko, L. I. 2013, ApJ, 770, 34 [Google Scholar]
- Lin, R. P. 1985, Sol. Phys., 100, 537 [NASA ADS] [CrossRef] [Google Scholar]
- Lin, R. P. 1995, Space Sci. Rev., 71, 125 [NASA ADS] [CrossRef] [Google Scholar]
- Lin, R. P., Potter, D. W., Gurnett, D. A., & Scarf, F. L. 1981, ApJ, 251, 363 [Google Scholar]
- Lin, R. P., Dennis, B. R., Hurford, G. J., et al. 2002, Sol. Phys., 210, 3 [Google Scholar]
- Mason, G. M., Gold, R. E., Krimigis, S. M., et al. 1998, Space Sci. Rev., 86, 409 [NASA ADS] [CrossRef] [Google Scholar]
- Mason, G. M., Nitta, N. V., Cohen, C. M. S., & Wiedenbeck, M. E. 2009, ApJ, 700, L56 [NASA ADS] [CrossRef] [Google Scholar]
- Pick, M., Mason, G. M., Wang, Y. -M., Tan, C., & Wang, L. 2006, ApJ, 648, 1247 [NASA ADS] [CrossRef] [Google Scholar]
- Reames, D. V. 1999, Space Sci. Rev., 90, 413 [Google Scholar]
- Reames, D. V., von Rosenvinge, T. T., & Lin, R. P. 1985, ApJ, 292, 216 [Google Scholar]
- Rust, D. M., Haggerty, D. K., Georgoulis, M. K., et al. 2008, ApJ, 687, 635 [CrossRef] [Google Scholar]
- Shibata, K., Nitta, N., Strong, K. T., et al. 1994, ApJ, 431, L51 [NASA ADS] [CrossRef] [Google Scholar]
- Shimojo, M., & Shibata, K. 2000, ApJ, 542, 1100 [NASA ADS] [CrossRef] [Google Scholar]
- Schrijver, C. J., & DeRosa, M. L. 2003, Sol. Phys., 212, 165 [Google Scholar]
- Sun, L. P. 2012, Ph.D. Thesis, Univ. Würzburg [Google Scholar]
- Wang, L. 2009, Ph.D. Thesis, Univ. California, Berkeley [Google Scholar]
- Wang, L., Lin, R. P., Krucker, S., & Gosling, J. T. 2006a, Geophys. Res. Lett., 33, L03106 [NASA ADS] [CrossRef] [Google Scholar]
- Wang, Y.-M., Pick, M., & Mason, G. M. 2006b, ApJ, 639, 495 [NASA ADS] [CrossRef] [Google Scholar]
- Wang, L., Lin, R. P., & Krucker, S. 2011, ApJ, 727, 121 [NASA ADS] [CrossRef] [Google Scholar]
- Wang, L., Lin, R. P., Krucker, S., & Mason, G. M. 2012, ApJ, 759, 69 [NASA ADS] [CrossRef] [Google Scholar]
All Figures
|
Fig. 1 Panel a) Electron intensity profiles detected by Wind/3DP/SSTs (27–310 keV) on 2002 October 20. The black lines indicate the original fluxes, and the colored lines show fluxes after correction for scatter-out electrons. Panel b) Electron intensity profiles detected by Wind/3DP/EESAs (1.3–19 keV). Panel c) Onset times of electron fluxes as a function of inverse velocities. The red line indicates a linear fit to electrons above ~25 keV, and the blue one shows a fit below 13 keV. |
| In the text | |
|
Fig. 2 Intensity profiles of 3He (bottom panel) and ratios of 3He/4He (top panel) observed by ACE/ULEIS. The energy ranges for the blue, red, and yellow lines are 0.06–0.16, 0.16–0.32, and 0.32–0.64 MeV nucleon-1, respectively. |
| In the text | |
|
Fig. 3 Left panel: SOHO/EIT 195 Å image with a previous one subtracted. Red contour lines indicate the RHESSI HXR source in 25−50 keV at 14:22:20 UT. Blue boxes mark AR10154 and AR10160, respectively. Black arrow marks the dimming region. Right panel: Jet-like CME observed by SOHO/LASCO WL image with a previous one subtracted. Yellow contour lines indicate the NRH radio source in 164 MHz at 14:12:09 UT. |
| In the text | |
|
Fig. 4 GOES SXR flux in 1–8 Å and the Wind/WAVES radio dynamic spectra in the frequency range of 20 kHz to 14 MHz. Blue dashed lines mark the SPR times of low-energy (≲13 keV) and high-energy (~25 to ~300 keV) electrons, respectively. Line thickness indicates the error estimate. |
| In the text | |
|
Fig. 5 PFSS modeled coronal magnetic configurations above AR10154 and AR10160, respectively. The red lines mark the open field lines and brown lines mark the closed ones. Black lines mark the connection longitudes where the well connected IMF lines intersect the solar source surface. |
| In the text | |
Current usage metrics show cumulative count of Article Views (full-text article views including HTML views, PDF and ePub downloads, according to the available data) and Abstracts Views on Vision4Press platform.
Data correspond to usage on the plateform after 2015. The current usage metrics is available 48-96 hours after online publication and is updated daily on week days.
Initial download of the metrics may take a while.