Fig. 8
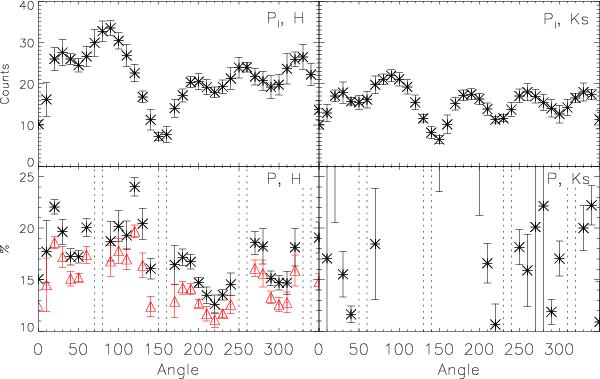
Azimuthal (angles computed east of north) variation of the PI (top row) and P (bottom row) images, for the H (left column) and Ks bands (right column). The position of the telescope’s spiders is indicated by the dashed lines. In the P plot at H band, the stars and the triangles represent the lower and upper limits of P (see text for a detailed explanation). The P image at Ks band is too contaminated by artifacts (see Fig. 3, right-bottom plot).
Current usage metrics show cumulative count of Article Views (full-text article views including HTML views, PDF and ePub downloads, according to the available data) and Abstracts Views on Vision4Press platform.
Data correspond to usage on the plateform after 2015. The current usage metrics is available 48-96 hours after online publication and is updated daily on week days.
Initial download of the metrics may take a while.