Fig. 4
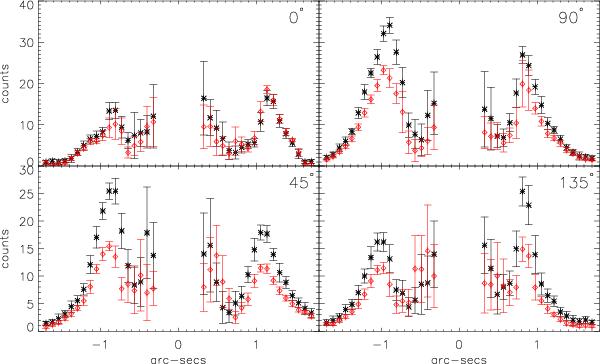
PI radial cuts: H- and Ks-band cuts are plotted in black asterisks and red diamonds, respectively. Innermost regions have been masked out due to their significantly higher noise. Each point represents the mean value of the PI image at a given distance from the center, within a squared piece of 3 × 3 px (0.08′′ × 0.08′′). The error bars are the standard deviation inside each piece. The number at the upper-right corner in each plot indicates the PA (measured east of north) of the cut. The plot at 0° shows a cut from north (top) to south (bottom). In the other plots, the radial cuts start from the eastern side (left-side) of the images to the western side (right-side) of the images.
Current usage metrics show cumulative count of Article Views (full-text article views including HTML views, PDF and ePub downloads, according to the available data) and Abstracts Views on Vision4Press platform.
Data correspond to usage on the plateform after 2015. The current usage metrics is available 48-96 hours after online publication and is updated daily on week days.
Initial download of the metrics may take a while.