Fig. 3
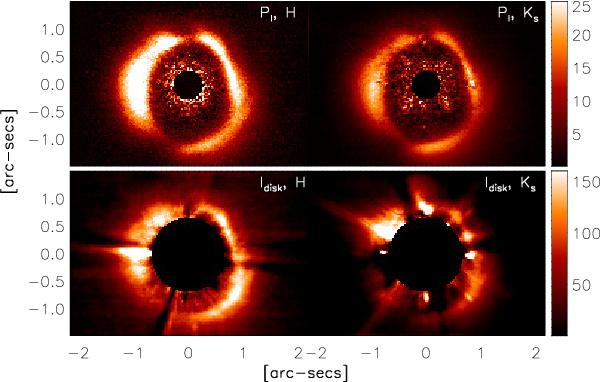
PI (top row) and Idisk (bottom row) images at H (left column) and Ks band (right column) of HD 142527. Masked area in the PI images cover the saturate region, while in the PSF-subtracted images cover the artifact-dominated regions. The PI are plotted with the same scale to enhance differences/similarities. The same is done with the Idisk images. The bright patch in the Idisk image at north-east direction in Ks band is an artifact due to the PSF-subtraction (as it is the bright path on the east direction in the Idisk image at H band, see also the caption in Fig. 2). Color bar units are given in counts.
Current usage metrics show cumulative count of Article Views (full-text article views including HTML views, PDF and ePub downloads, according to the available data) and Abstracts Views on Vision4Press platform.
Data correspond to usage on the plateform after 2015. The current usage metrics is available 48-96 hours after online publication and is updated daily on week days.
Initial download of the metrics may take a while.