Fig. 1
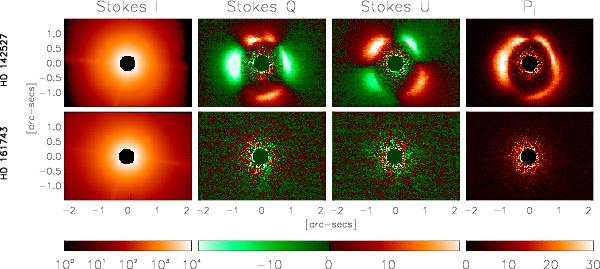
Processed images of HD 142527 (top row) and HD 161743 (bottom row) in H band. From left to right: intensity image (I) in logarithmic scale, Stokes Q, U and PI images in linear scale. For comparison purposes, HD 161743 has been scaled by an arbitrary factor. Units are given in counts. The area corresponding to the saturated pixels (rsat ≤ 0.32′′) in HD 142527 has been masked out in all images. The polarized images of HD 142527 show a complex structure, while the comparison star only shows remnant noise. In all images north is up and east is left. This applies to all the figures in this paper.
Current usage metrics show cumulative count of Article Views (full-text article views including HTML views, PDF and ePub downloads, according to the available data) and Abstracts Views on Vision4Press platform.
Data correspond to usage on the plateform after 2015. The current usage metrics is available 48-96 hours after online publication and is updated daily on week days.
Initial download of the metrics may take a while.