Fig. 3
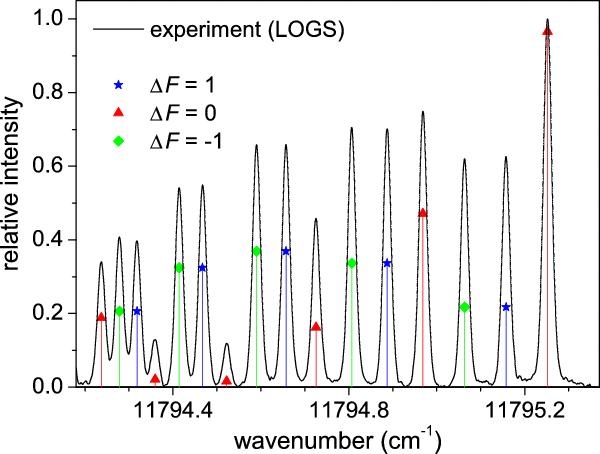
Fully resolved line to illustrate the magnitude of intensity increase of the weak components. Theoretical relative intensities calculated following Eq. (3) are given as arrows; the arrows are normalised to the strongest hfs component: transition from 9 043.14 cm-1, J = 5/2 − → 20 837.98 cm-1, J = 5/2 at λair = 847.596 nm or σvac = 11 794.84 cm-1.
Current usage metrics show cumulative count of Article Views (full-text article views including HTML views, PDF and ePub downloads, according to the available data) and Abstracts Views on Vision4Press platform.
Data correspond to usage on the plateform after 2015. The current usage metrics is available 48-96 hours after online publication and is updated daily on week days.
Initial download of the metrics may take a while.