Fig. 2
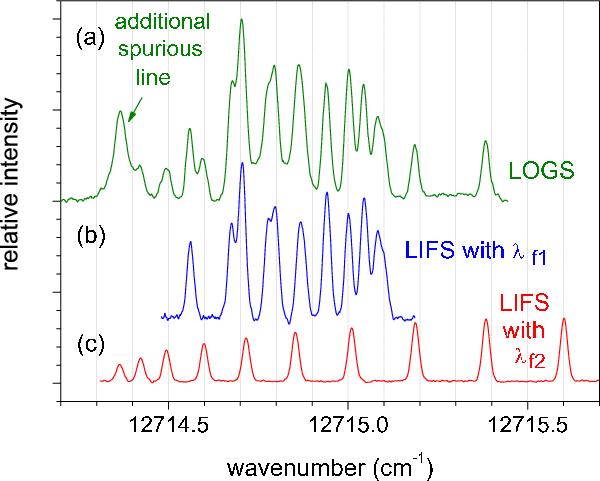
Example for blended lines: a) Spectrum recorded by LOGS at around 12 715 cm-1 showing the overlap of two Nb lines as well as another spurious line. b) Spectrum recorded by LIFS with fluorescence λf = 532.15 nm: transition from 14 899.26 cm-1, J = 5/2 − → 27 614.10 cm-1, J = 5/2 at λair = 786.266 nm or σvac = 12 714.84 cm-1. c) Spectrum recorded by LIFS with fluorescence λf = 581.94 nm: transition from 17 476.22 cm-1, J = 11/2 − → 30 191.25 cm-1, J = 13/2 at λair = 786.255 nm or σvac = 12 715.03 cm-1.
Current usage metrics show cumulative count of Article Views (full-text article views including HTML views, PDF and ePub downloads, according to the available data) and Abstracts Views on Vision4Press platform.
Data correspond to usage on the plateform after 2015. The current usage metrics is available 48-96 hours after online publication and is updated daily on week days.
Initial download of the metrics may take a while.