Fig. 3
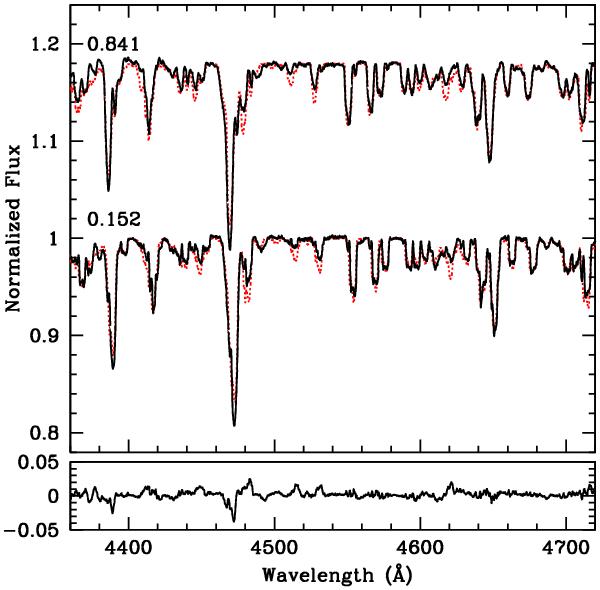
Comparison of the best-fit CoMBiSpeC model (dots) with the ESPaDOns spectra of Spica at orbital phases 0.152 (15 March) and 0.841 (26 March; shifted by +0.2 continuum units). The tracing shown at the bottom is the difference between the 15 March spectrum and its corresponding synthetic spectrum and shows that the fit is good to ~3%.
Current usage metrics show cumulative count of Article Views (full-text article views including HTML views, PDF and ePub downloads, according to the available data) and Abstracts Views on Vision4Press platform.
Data correspond to usage on the plateform after 2015. The current usage metrics is available 48-96 hours after online publication and is updated daily on week days.
Initial download of the metrics may take a while.