Fig. 2
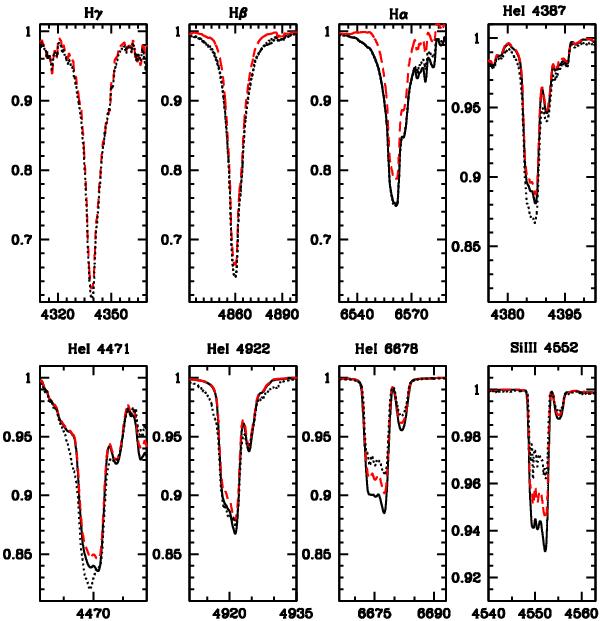
Dependence of line strength on microturbulent speed vturb. As in Fig. 1, the same stellar atmosphere model computed with vturb = 2 (dots), 10 (dashes) and 15 (continuous) km s-1 is shown. The behaviour of the stronger He i lines is different from that of weaker lines. In the H-lines, the dependence on vturb is strongest in the line wings.
Current usage metrics show cumulative count of Article Views (full-text article views including HTML views, PDF and ePub downloads, according to the available data) and Abstracts Views on Vision4Press platform.
Data correspond to usage on the plateform after 2015. The current usage metrics is available 48-96 hours after online publication and is updated daily on week days.
Initial download of the metrics may take a while.