Fig. 11
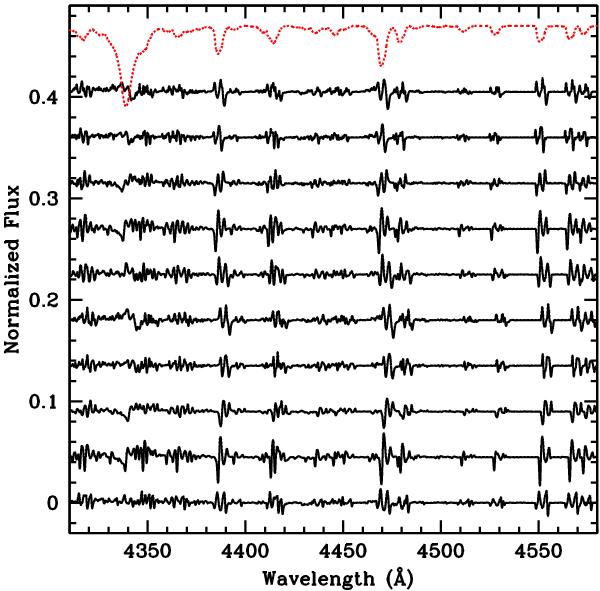
Difference between the synthetic perturbed spectra of the primary and the corresponding unperturbed spectra showing that the lines of intermediate intensity display the most prominent variations in the “bump” structure. The orbital phases increase from bottom to top with increments of Δφ = 0.1 and starting with φ = 0. Differences are shifted along the vertical axis for clarity. The dotted tracing at the top is the perturbed spectrum at φ = 0.90, scaled and shifted to fit in this figure.
Current usage metrics show cumulative count of Article Views (full-text article views including HTML views, PDF and ePub downloads, according to the available data) and Abstracts Views on Vision4Press platform.
Data correspond to usage on the plateform after 2015. The current usage metrics is available 48-96 hours after online publication and is updated daily on week days.
Initial download of the metrics may take a while.