| Issue |
A&A
Volume 556, August 2013
|
|
|---|---|---|
| Article Number | A64 | |
| Number of page(s) | 5 | |
| Section | Planets and planetary systems | |
| DOI | https://doi.org/10.1051/0004-6361/201321881 | |
| Published online | 29 July 2013 | |
Prospects of detecting the polarimetric signature of the Earth-mass planet α Centauri B b with SPHERE/ZIMPOL
1
Institut de Planétologie et d’Astrophysique de Grenoble (IPAG), University
Joseph Fourier, CNRS,
BP 53,
38041
Grenoble,
France
e-mail:
julien.milli@obs.ujf-grenoble.fr
2
European Southern Observatory, Casilla 19001, Santiago 19, Chile
3
Institute for Astronomy, ETH Zurich, 8093
Zurich,
Switzerland
4
Laboratoire d’Astrophysique de Marseille
(LAM), 13388
Marseille,
France
Received:
12
May
2013
Accepted:
4
June
2013
Context. Over the past five years, radial-velocity and transit techniques have revealed a new population of Earth-like planets with masses of a few Earth masses. Their very close orbit around their host star requires an exquisite inner working angle to be detected in direct imaging and sets a challenge for direct imagers that work in the visible range, such as SPHERE/ZIMPOL.
Aims. Among all known exoplanets with less than 25 Earth masses we first predict the best candidate for direct imaging. Our primary objective is then to provide the best instrument setup and observing strategy for detecting such a peculiar object with ZIMPOL. As a second step, we aim at predicting its detectivity.
Methods. Using exoplanet properties constrained by radial velocity measurements, polarimetric models and the diffraction propagation code CAOS, we estimate the detection sensitivity of ZIMPOL for such a planet in different observing modes of the instrument. We show how observing strategies can be optimized to yield the best detection performance on a specific target.
Results. In our current knowledge of exoplanetary systems, α Centauri B b is the most promising target with less than 25 Earth masses for ZIMPOL. With a gaseous Rayleigh-scattering atmosphere and favorable inclinations, the planet could be detected in about four hours of observing time, using the four-quadrant phase-mask coronograph in the I band. However, if α Centauri B b should display unfavorable polarimetric and reflective properties similar to that of our Moon, it is around 50 times fainter than the best sensitivity of ZIMPOL.
Conclusions. α Centauri B is a primary target for SPHERE. Dedicated deep observations specifically targeting the radial velocity-detected planet can lead to a detection if the polarimetric properties of the planet are favorable.
Key words: instrumentation: high angular resolution / planets and satellites: detection / instrumentation: polarimeters / polarization / planets and satellites: individual: alpha Centauri / planets and satellites: atmospheres
© ESO, 2013
1. Introduction
Imaging planets is a very attractive goal to improve our understanding of planetary systems. So far, it has only been achieved in the near-infrared1 by detecting the thermal emission of young (1−100 Myr) and massive Jupiter-size planets at large distances from their host stars (5−100 AU). Imaging planets in visible reflected light is also very valuable. However, while the flux reflected by the planet is highest at a very small orbit, the stellar halo is stronger than that of the planet at such a short separation. Moreover, the adaptive optics (AO) correction is not favorable at visible wavelengths. The contrast required is around 4 × 10⁻¹⁰ for an earth at 1 AU from its host star, while the angular separation is only 0.1′′ for a star at 10 pc.
However, to help detection, a specific property of scattered light can be used: polarization. Polarimetric differential imaging (PDI) is already widely used to enhance the contrast between a star and circumstellar material, e.g., to reveal protoplanetary disks. Currently, two 8-m class telescopes provide subarcsec-resolved imaging with a dual-beam polarimeter: Subaru/HiCIAO and VLT/NaCo. The latter revealed polarized circumstellar emission down to 18 mag/arcsec2 at 1.5″ on HD 169142 (Quanz et al. 2013). A dedicated instrument for exoplanet search in the visible light will now be installed at the VLT as part of the SPHERE instrument (Beuzit et al. 2008): ZIMPOL, the Zurich IMaging POLarimeter (Schmid et al. 2006). It uses the SPHERE AO system and coronographic masks. ZIMPOL has demonstrated polarimetric sensitivities of 10-5 locally with an absolute polarimetric accuracy of 10-3. Fast polarimetric modulation is performed using a ferroelectric liquid crystal to swap two orthogonal linear polarization states at 1 kHz. A polarization beamsplitter converts this modulation into an intensity modulation, which is then demodulated in real-time by a special masked charge-shifting CCD detector. The same CCD pixels are used for the detection of both polarization states to minimize differential effects. Since the modulation period is shorter than the seeing variation timescale, speckle noise is strongly reduced in the polarization image.
The large majority of low-mass exoplanets (Mpl ≤ 25 MEarth) detected in transit or radial velocity (RV) have a projected angular separation at quadrature smaller than the ZIMPOL inner working angle however, 2λ/d at 600 nm or 0.03”. Those with a preliminary intensity contrast higher than one part per billion (10-9) and a projected separation larger than 0.03” are named in Fig. 1 and constitute our sample selection. The preliminary intensity contrast is given by f·(Rpl/a)2 assuming the same reflectance f = 0.2 for all planets (corresponding to the Rayleigh-scattering atmosphere described below and a scattering angle α = 87°). The radius Rpl is computed from the RV mass Mplsini assuming an Earth bulk density. The vertical dotted line shows the ZIMPOL inner working angle. Of the 11 targets, α Cen B b is by far the most promising with its intensity contrast of more than 2 × 10⁻⁷. It has a semi-major axis a = 0.04 AU (Dumusque et al. 2012). Because its parent star is the second-closest star after Proxima Centauri at a distance of 1.34 pc, the projected separation is enhanced but remains small: 0.03” at quadrature.
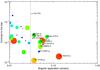 |
Fig. 1 Preliminary intensity contrast of known exoplanets of less than 25 Earth masses confirmed before May 2013 (from exoplanets.eu). The size and color (from blue to red) of the dots are proportional to the planet mass. |
Polarimetric differential imaging is complementary to RV techniques, which have a projection ambiguity because the system inclination i is unknown and only the projected mass M × sini can be determined. This degeneracy can be broken with multi-epoch direct images. α Cen B b could then become the first exoplanet to be unambiguously detected both in RV and direct imaging. The only other planet directly imaged with tight RV constraints is β Pic b (Lagrange et al. 2012), for which we can constrain its true mass to the range 9−12 MJup independently from brightness-mass relations. Moreover, polarimetry gives additional constraints on the planet’s atmospheric and surface properties even if those models are highly degenerated.
2. Expected polarimetric signatures of α Cen B b
The linear polarization is commonly described using the Stokes parameters Q and U. Each of them can be obtained with the difference in intensity between beams with opposite linear polarization (I0° and I90° for Stokes U,I45° and I− 45° for Stokes V). From RV data, the planet orbital phase angle can be predicted, but not the system inclination i, therefore the planet position angle (PA) on sky is unknown and the direction of linear polarization of the planet cannot be predicted. Consequently, the parameters Q and U have both to be measured.
For a given observation at time t, we call φ the orbital phase angle of the planet (φ = 0° at inferior conjunction and φ = 90° at quadrature). The remaining unknown parameters upon which the Stokes Q and U parameters depend Stokes Q and U are the following:
-
The system inclination i. This will entirely define the scattering angle α of the planet, given by α(φ,i) = arccos(cosφsini). We assumed that the orbit was fully circularized given the low value of a. Four discrete inclinations 10°, 30°, 60°, and 90° are used in our simulations, corresponding to a planet true mass of 6.6, 2.2, 1.3, and 1.1 Earth masses.
-
The disk integrated reflectance f(α,λ) and polarization fraction p(α,λ) as a function of α. The product f × p is called polarized reflectance hereafter.
-
The planet radius Rpl estimated from the mass-radius relation derived for terrestrial planets by Sotin et al. (2007), with Rpl proportional to Mpl0.274. It ranges between 1.7 REarth for a 10° inclination and 1.0 REarth for an edge-on system.
 . We investigate two
polarization models for the planet:
. We investigate two
polarization models for the planet:
-
Moon-like planet.
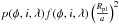
This model corresponds to a rocky planet with polarimetric properties like the Moon. Given the small mass and orbital distance of α Cen B b, a tiny atmosphere or even no atmosphere at all is a realistic assumption. The light is reflected from the solid surface and Moon- or Mercury-like properties are therefore plausible. From a detection point of view this would represent a worst case scenario. We used reflectance and polarization fraction measurements of the Moon derived from Coyne & Pellicori (1970) and Kieffer & Stone (2005) for this scenario. They are displayed in Fig. 2. The polarized reflectance reaches a maximum of 0.13% for a scattering angle of 60° and there is little wavelength dependence in the 600−900 nm range.
-
Planet with a Rayleigh-scattering atmosphere.
In more favorable conditions, the planet is assumed to have a rocky core and to retain a Rayleigh-scattering atmosphere that reflects and polarizes much more incident starlight. We used the polarization model presented in Buenzli & Schmid (2009) for that purpose. It assumes a multiple-scattering atmosphere above a Lambertian surface. It is described by three parameters: the surface albedo As, the atmosphere total optical depth τ, and the single scattering albedo ω. We chose the most favorable parameter set corresponding to a deep (τ = 30) conservative (ω = 1) Rayleigh-scattering atmosphere above a perfectly reflecting Lambert surface (As = 1). The polarized reflectance peaks at 8.1% for a scattering angle of 63°. Likely scenarii for such a deep atmosphere would be a planetary surface hot enough to sublimate, explosive volcanism, and/or a slowly evaporating atmosphere.
We did not consider the case of an ocean planet as initially introduced by Kuchner (2003) and Léger et al. (2004). Although the polarimetric signature of ocean planets is peculiar because the presence of the specular reflection on the planet’s liquid surface in addition to Rayleigh scattering in the atmosphere (McCullough 2006), runaway greenhouse excludes the possibility that α Cen B b could sustain liquid water on its surface. A runaway greenhouse is indeed possible for an ocean planet at the orbit of Venus (Kopparapu et al. 2013), and α Cen B b receives an insulation as strong as 193 times that received by Venus.
Expected contrast in polarized light, expressed in parts per billion (10-9) assuming the Rayleigh-scattering atmospheric model, except for α Cen B b where both models are displayed.
As ZIMPOL is able to perform polarimetry at different visible wavelengths from 515 nm to 900 nm, we investigated how chromatic the integrated reflectance and polarization fraction are. α Cen B is a late-type star (spectral type K1V), therefore more scattered flux is expected at longer wavelengths. For our two models, reflectance is also higher at longer wavelengths but the polarization fraction is smaller so that the polarized reflectance is very achromatic over the spectral range and should not be considered a critical item when selecting the wavelength band from an astrophysical point of view.
For each of the two models, we computed the expected polarized contrast of α Cen B b for different system inclinations i and at different orbital phase angles φ corresponding to different angular separations of the planet. The value displayed in Table 1 corresponds to the orbital phase angle that leads to the highest contrast under the constraint that the projected angular separation is greater than 0.03″. As an exercise, we repeated this task for the other ten targets presented in Fig. 1, keeping only the favourable Rayleigh-scattering model. This confirms the preliminary result from Fig. 1: among low-mass planets (Mpl ≤ 25 MEarth), α Cen B b is an order of magnitude brighter in polarized reflected light than any other potential target for ZIMPOL. The expected polarimetric contrast varies between 1 and 223 ppb, depending on the assumptions.
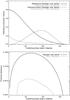 |
Fig. 2 Reflectance f and polarization fraction p (top) and polarized reflectance f·p (bottom) of the two planet models. For the Moon-like planet, properties are given for the I band. |
3. Observing strategies and instrumental setup
In a second step, the expected planet polarization signature has to be compared with the ZIMPOL detectivity. This is made by adding the planets polarization signal in a simulated point-spread function (PSF) produced by the official SPHERE/ZIMPOL simulator (Thalmann et al. 2008). It uses the diffraction code CAOS (Carbillet et al. 2008).
3.1. Observing strategies
To minimize telescope time, we considered an observing scenario where the target is repeatedly observed at the most favorable planetary orbit phase angles with respect to the ZIMPOL sensitivity, namely close to quadrature. The planet position is the same at each visit and the frames can be combined in order to enhance the planet’s signal-to-noise ratio (S/N). For each visit, the baseline considered is a four-hour observation to measure both the Stokes Q and U parameters, or two hours on each Stokes parameter. Given the short period of the planet, this is indeed the longest integration that does not lead to a significant planet smearing due to its orbital motion. At the best orbital phase angle of 80°, the smearing of the planet α Cen B b on the detector during a two-hour observation remains below 0.3 λ/d if the system inclination is above 30°, and it is smaller than 0.4 λ/d in all cases. Therefore, the expected dilution of the signal was not taken into account in this simulation.
3.2. ZIMPOL setup
ZIMPOL’s best polarimetric performances are achieved in fast polarimetry: polarimetric modulations are performed at 1 kHz, faster than the turbulence timescale. This eliminates most of the stellar halo and its speckle pattern. A quasi-static pattern remains at a level of 10-4 with respect to the stellar core because of the low-level optical polarization and the wavefront error variation induced by the polarimetric swap. This pattern is additionally reduced by polarimetric switching introduced by a 45° rotation of the half-wave plate (HWP) where the sign of the polarization in front of the switch is reversed, whereas the sign of the instrumental polarization after the switch remains unchanged. This way the static instrumental effects are eliminated by the data reduction process. The remaining level of residuals can be additionally reduced by averaging images corresponding to different offsets of the derotator. This is called active field-rotation. We assumed twelve derotator offsets, which additionally decreased the noise by a factor 3.5. Appendix A quantifies the noise contributors and describes the data reduction steps. The final contrast value is below 10-7 at 2λ/D.
As the expected separation of α Cen B b is 2λ/D, observations can only be planned with the two 4QPM coronographs or without any coronograph. The Lyot masks do not provide a small enough inner working angle. As the 4QPM are chromatic, two filters are studied here: broad-band I and R, with a central wavelength of 790 nm and 626 nm respectively, and a spectral width of 150 nm. The case without coronograph is studied here with the broader filter in ZIMPOL: very broad-band RI covering the full 590 nm to 880 nm spectral range. Figure 3 shows the contrast comparison in the different bands. The 4QPM in the I-band gives results more than one order of magnitude better than saturated images or than the 4QPM-R at the separation of α Cen B b. It is more efficient to reject light thanks to a better AO correction (cf. Appendix A). This advantage more than compensates for the fact that no coronograph allows a broader bandpass. An additional drawback of not using any coronograph is that saturation is dangerously close to α Cen B b.
It could be argued that the presence of the planet at a separation around or slightly below 2λ/D could be a problem for detection because this is considered as the inner working angle for the 4QPM coronograph. However, the extinction rate of a companion located at 45° from a mask transition is relatively constant between 1.7 and 2λ/D (Riaud et al. 2001).
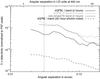 |
Fig. 3 Comparison of the performance of ZIMPOL at close separation in the different bands. Quasi-static, photon, and readout noise are included. |
4. Results
As shown in Fig. 4, a rocky planet with a Rayleigh-scattering atmosphere is detected above the 5σ level whatever the inclination of the system in a total of four hours (two hours for each Stokes parameter Q and U). The detection is easier for pole-on systems since the planet’s true mass, hence the radius too, is greater. In most cases the detectivity is best for an orbital phase angle φ between 80° and 90°, therefore the observations should be planned to be conducted in this window. For a rocky planet with Moon-like properties, the detection level is about 50 times fainter than the ZIMPOL sensitivity in four hours. For comparison we overplotted the photon noise level for 20 h of observations. It corresponds to the best possible detectivity level assuming we succeeded in removing all differential aberrations down to that level. A deep understanding of the instrument stability complemented by advanced post-processing techniques will be necessary.
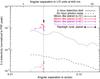 |
Fig. 4 Detection level of the two planet models with the 4QPM coronograph in the I band. The symbols indicate the planet signal for an orbital phase angle φ of 40°, 60°, 80°, and 90° respectively. |
5. Conclusions
We have studied the detectivity of known low-mass exoplanets with the SPHERE/ZIMPOL instrument using two polarization models. Among planets with a mass smaller than 25 Earth masses, α Cen B b is by an order of magnitude the best-known candidate for a direct detection in polarized reflected light. It would be a groundbreaking result unlikely to be surpassed for some time due to the proximity of this exoplanet to Earth. The best setup to observe α Cen B b is to use the fast polarimetric mode of ZIMPOL in the broad-band I filter with the 4QPM coronograph.
A rocky planet with an atmosphere that has ideal Rayleigh-scattering properties can be detected in four hours whatever the inclination but a planet without an atmosphere and with unfavorable scattering properties like the Moon would pass unnoticed. A scenario that could potentially enhance the polarized reflectance is the atmospheric escape that would produce a cometary-tail of ionized gas because the stellar tidal forces extend the Roche limit and the strong radiations heat the planetary surface. The escape of atomic hydrogen was previously revealed for HD 209458 b (Vidal-Madjar et al. 2003), but observational constraints are scarce. These effects may lead to a much stronger polarimetric signature, but a detailed calculation is beyond the scope of this paper. If the 20-h photon noise level can be reached by combining several observation epochs and suppressing systematics effects, the 5σ contrast level is decreased to 5 × 10⁻⁹. This is still above the signal of a Moon-like α Cen B b, but many kinds of planets without ideal Rayleigh-scattering atmosphere become detectable. This also represents the 5σ contrast level of our ideal Rayleigh-scattering model for a planet with the same mass but a period of 56 days (28 days respectively) if the system is inclined at 10° (90° respectively). Such a planet might have passed unnoticed among radial velocity measurements, especially because the star’s rotational periods are about 40 days long. Alternatively, with this contrast level, we are now sensitive to much lighter planets whose RV signals are undetectable, so direct imaging will definitely bring a very interesting diagnostic to the planetary system around α Cen B. The results presented here are based on instrument properties as they are known now, but it is clear that more investigations for the best data combination and signal extraction will be pushed forward on the basis of the first on-telescope results.
Except for Fomalhaut b detected by Kalas et al. (2008) with HST/ACS and confirmed by Galicher et al. (2013) and Currie et al. (2012), but this is a controversial case because the nature of the object has yet to be revealed.
References
- Beuzit, J.-L., Feldt, M., Dohlen, K., et al. 2008, in SPIE Conf. Ser., 7014 [Google Scholar]
- Buenzli, E., & Schmid, H. M. 2009, A&A, 504, 259 [NASA ADS] [CrossRef] [EDP Sciences] [Google Scholar]
- Carbillet, M., Boccaletti, A., Thalmann, C., et al. 2008, in SPIE Conf. Ser., 7015 [Google Scholar]
- Coyne, G. V., & Pellicori, S. F. 1970, AJ, 75, 54 [NASA ADS] [CrossRef] [Google Scholar]
- Currie, T., Debes, J., Rodigas, T. J., et al. 2012, ApJ, 760, L32 [NASA ADS] [CrossRef] [Google Scholar]
- Dumusque, X., Pepe, F., Lovis, C., et al. 2012, Nature, 491, 207 [NASA ADS] [CrossRef] [PubMed] [Google Scholar]
- Galicher, R., Marois, C., Zuckerman, B., & Macintosh, B. 2013, ApJ, 769, 42 [Google Scholar]
- Kalas, P., Graham, J. R., Chiang, E., et al. 2008, Science, 322, 1345 [NASA ADS] [CrossRef] [PubMed] [Google Scholar]
- Kieffer, H. H., & Stone, T. C. 2005, AJ, 129, 2887 [NASA ADS] [CrossRef] [Google Scholar]
- Kopparapu, R. K., Ramirez, R., Kasting, J. F., et al. 2013, ApJ, 765, 131 [NASA ADS] [CrossRef] [Google Scholar]
- Kuchner, M. J. 2003, ApJ, 596, L105 [NASA ADS] [CrossRef] [Google Scholar]
- Lagrange, A.-M., De Bondt, K., Meunier, N., et al. 2012, A&A, 542, A18 [NASA ADS] [CrossRef] [EDP Sciences] [Google Scholar]
- Léger, A., Selsis, F., Sotin, C., et al. 2004, Icarus, 169, 499 [NASA ADS] [CrossRef] [Google Scholar]
- McCullough, P. R. 2006, unpublished [arXiv:astro-ph/0610518] [Google Scholar]
- Quanz, S. P., Avenhaus, H., Buenzli, E., et al. 2013, ApJ, 766, L2 [NASA ADS] [CrossRef] [Google Scholar]
- Riaud, P., Boccaletti, A., Rouan, D., Lemarquis, F., & Labeyrie, A. 2001, PASP, 113, 1145 [NASA ADS] [CrossRef] [Google Scholar]
- Roelfsema, R., Gisler, D., Pragt, J., et al. 2011, in SPIE Conf. Ser., 8151 [Google Scholar]
- Schmid, H. M., Beuzit, J.-L., Feldt, M., et al. 2006, in Direct Imaging of Exoplanets: Science & Techniques, eds. C. Aime, & F. Vakili, IAU Colloq., 200, 165 [Google Scholar]
- Schmid, H.-M., Downing, M., Roelfsema, R., et al. 2012, in SPIE Conf. Ser., 8446 [Google Scholar]
- Sotin, C., Grasset, O., & Mocquet, A. 2007, Icarus, 191, 337 [NASA ADS] [CrossRef] [Google Scholar]
- Thalmann, C., Schmid, H. M., Boccaletti, A., et al. 2008, in SPIE Conf. Ser., 7014 [Google Scholar]
- Vidal-Madjar, A., Lecavelier des Etangs, A., Désert, J.-M., et al. 2003, Nature, 422, 143 [NASA ADS] [CrossRef] [PubMed] [Google Scholar]
Appendix A: ZIMPOL simulation description
A ZIMPOL simulation is conducted using the SPHERE software package for the CAOS problem-solving environment described in Carbillet et al. (2008). A comprehensive description of the ZIMPOL simulator is provided in Thalmann et al. (2008). We briefly summarize the simulation concept and assumptions. The diffraction code of CAOS produces PSFs for the central occulted star and for out-of axis planets, simulating the AO-corrected turbulence with 100 turbulent phase screens and static and differential aberrations. The differential aberrations account for temporal drifts in the common optical path on the timescale of the HWP signal-switching or differences between the two polarimetric channels. The atmospheric and telescope parameters are the same as described in Thalmann et al. (2008). The assumptions for the static aberrations were updated using data from manufacturing: static instrumental aberrations were decreased from 34.5 to 30 nm and AO calibration aberrations were decreased to 5nm. The two simulations of the 4QPM used a total of six wavelengths within the band while the very broad-band simulation used 36 wavelengths. The simulations show a Strehl ratio of about 50% in the I band with a peak rejection factor slightly above 100. We highlight however that a good AO tip-tilt correction is essential to reach a higher starlight rejection and the 4QPM coronographs display transitions between the quadrants that also degrade the star extinction performance. Additionally, the performance of the atmospheric dispersion corrector is degraded with the broad- and very broad-band filters.
In a second step, the PSFs produced by CAOS are combined with the star properties and latest instrumental transmission as measured in the laboratory (Roelfsema et al. 2011). The detector integration time (DIT) was adjusted within its range (0.16 to 10 s in the windowed 1″ × 1″ detector mode). With the minimal DIT, the detector is saturated to a level of 3, meaning almost up to the region of interest at 2λ/D, whereas the typical exposure time with the coronographs is 6s to reach the full dynamic of the detector. The photon, detector, and polarimetric noise are then added. The detector noise amounts to ten electrons (Schmid et al. 2012) for the windowed (1″ × 1″) readout mode selected, and a polarimetric sensitivity of 10-5 was used. This yields the two final images I0° and I90° with their 2 analogs once the HWP has been switched. We assumed that this switch was performed every five minutes and the resulting temporal aberrations are the same as described in Thalmann et al. (2008). The typical contrast level of the four images is shown in Fig. A.1 (top curve). The following steps are then performed:
-
Subtraction of the intensity images I0° from I90° (second curve from the top in Fig. A.1).
-
Subtraction of the resulting image from its analog after the HWP switch by
 (third curve from the top in Fig. A.1).
 -
Accounting for contrast improvements due to active field rotation. At a separation of 2λ/D, there are 2 × 2π = 12 resolution elements. Assuming there are independent realizations of a Gaussian process, a pattern with 12 derotator offsets would additionally decrease the remaining noise by a factor
 (darkest curve in
Fig. A.1).
(darkest curve in
Fig. A.1).
building the image that best matches the current one from a library of PSFs. When the instrument shows a stable behavior over time, this library could contain PSFs corresponding to telescope realizations at a different date or on different stars. Advanced image-processing algorithms could then be used to build the best-matching PSF and reduce the remaining aberrations even more.
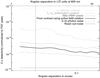 |
Fig. A.1 Decomposition of the final polarization contrast curve after the I0° − I90° image subtraction, HWP switch, and active field rotation using 12 derotator positions for a two-hour coronographic observation in the I band. Quasi-static speckles are the dominant noise contributor at short separation. |
All Tables
Expected contrast in polarized light, expressed in parts per billion (10-9) assuming the Rayleigh-scattering atmospheric model, except for α Cen B b where both models are displayed.
All Figures
|
Fig. 1 Preliminary intensity contrast of known exoplanets of less than 25 Earth masses confirmed before May 2013 (from exoplanets.eu). The size and color (from blue to red) of the dots are proportional to the planet mass. |
| In the text | |
|
Fig. 2 Reflectance f and polarization fraction p (top) and polarized reflectance f·p (bottom) of the two planet models. For the Moon-like planet, properties are given for the I band. |
| In the text | |
|
Fig. 3 Comparison of the performance of ZIMPOL at close separation in the different bands. Quasi-static, photon, and readout noise are included. |
| In the text | |
|
Fig. 4 Detection level of the two planet models with the 4QPM coronograph in the I band. The symbols indicate the planet signal for an orbital phase angle φ of 40°, 60°, 80°, and 90° respectively. |
| In the text | |
|
Fig. A.1 Decomposition of the final polarization contrast curve after the I0° − I90° image subtraction, HWP switch, and active field rotation using 12 derotator positions for a two-hour coronographic observation in the I band. Quasi-static speckles are the dominant noise contributor at short separation. |
| In the text | |
Current usage metrics show cumulative count of Article Views (full-text article views including HTML views, PDF and ePub downloads, according to the available data) and Abstracts Views on Vision4Press platform.
Data correspond to usage on the plateform after 2015. The current usage metrics is available 48-96 hours after online publication and is updated daily on week days.
Initial download of the metrics may take a while.