Fig. 5
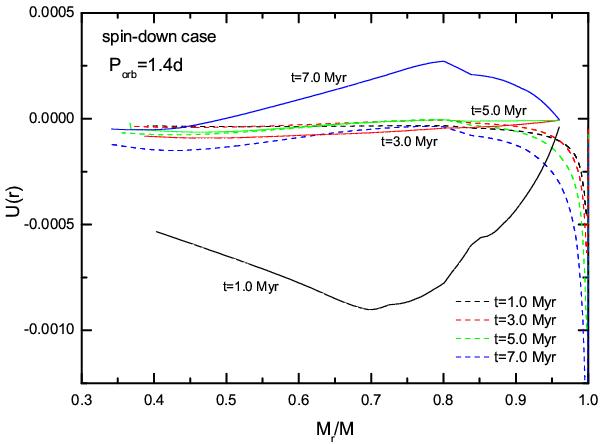
Amplitude of the vertical component of the meridional circulation velocity in cm per second in a 15 M⊙ model at various stages. The dashed lines correspond to a rotating model with υini = 0.6 υcrit and are computed without tidal interaction. The continuous lines show the situation when tidal interactions are accounted for, assuming a close companion of 10 M⊙ orbiting the primary with an initial period of 1.4 days. Different ages are plotted with different colors as indicated in the inset, for both the continuous and dashed lines. The different colors have the same meaning as in Fig. 2.
Current usage metrics show cumulative count of Article Views (full-text article views including HTML views, PDF and ePub downloads, according to the available data) and Abstracts Views on Vision4Press platform.
Data correspond to usage on the plateform after 2015. The current usage metrics is available 48-96 hours after online publication and is updated daily on week days.
Initial download of the metrics may take a while.